
Section 3: How significant is this relationship to army ant colonies?
FIGURE SET

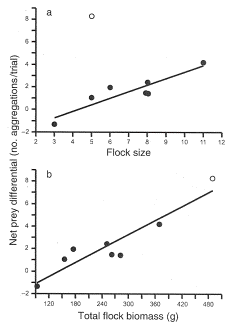
Figure 2. Cost of antbirds on foraging success of ants. Relationship between attending bird flock size (a) and flock biomass - combined mass of all birds following a swarm (b). Net prey differential is the difference in the number of prey aggregations between the control and exclusion treatment. E. burchelli aggregate on prey items when prey are too large to be handled by a single ant worker. In this study researchers measured "aggregations" larger than about 0.8 cm as an indication of ant foraging success because these aggregations persisted long enough for accurate measurements. Aggregations were measured in 20 min. trials in which antbirds were scared off by researchers (exclusion) and in controls (no exclusion). Area studied was about 10 m2. The open symbol is a trial where one very large bird, a Rufous-vented Ground-Cuckoo (350 g, vs. 20-40 g/bird for other species), was present. From Wrege et al. (2005).