Figure Set 5: Gypsy Moth Invasion and Links to Outbreaks of Lyme Disease
FIGURE SET 1
-
Figure 5A.
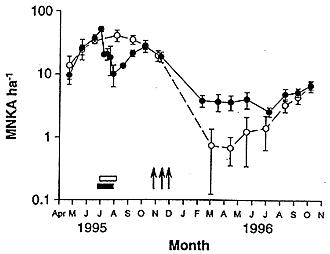
Average density per hectare (2.2 acres) of white-footed mice in 3 control (open circles) and 3 experimental (closed circles) areas. The vertical lines are standard
errors which are a statistical measure of the range of the 3 replicates. The data show (1) 1995 mouse densities before, during, and after mouse removal from the
experimental areas (black bar) from experimental areas duing the time when gypsy moths pupate (become larvae; white bar); (2) 1995 mouse densities before and
during addition of oak acorns (black arrows) to experimental areas in October-November 1995 when there were naturally few acorms produced by trees
in the control areas, and (3) 1996 mouse densities after acorn additions to experimental areas in 1995. Mouse densities typically go up when oaks produce
more acorns and they naturally decline in the winter (from Jones, C. G., R. S. Ostfeld, M. P. Richard, E. M. Schauber, and J. O. Wolff. 1998. Chain reactions
linking acorns to gypsy moth outbreaks and lyme disease risk. Science 279: 1023-1026).
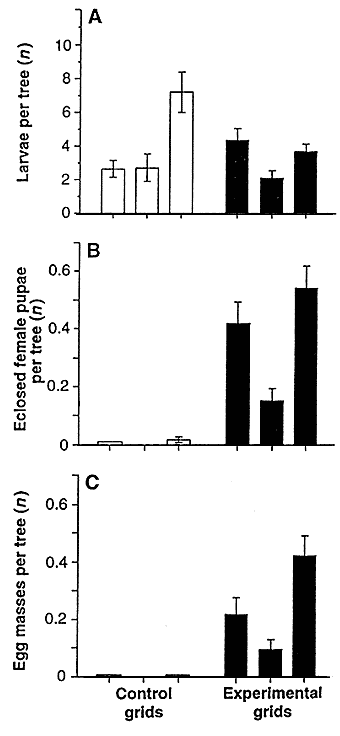
Figure 5B. Densities of gypsy moth life stages on or under burlap bands placed around trees in control areas (open bars) and experimental areas (solid bars) where white-footed mice were removed. The bars show averages and the vertical lines standard errors which are a statistical measure of the range of the replicates within each area. A is the number of living late-stage moths per tree just before mouse removal. B is the number of female pupae per tree successfully changing into adults after mouse removal. C is the number of moth egg masses per tree after mouse removal (from Jones, C. G., R. S. Ostfeld, M. P. Richard, E. M. Schauber, and J. O. Wolff. 1998. Chain reactions linking acorns to gypsy moth outbreaks and lyme disease risk. Science 279: 1023-1026).
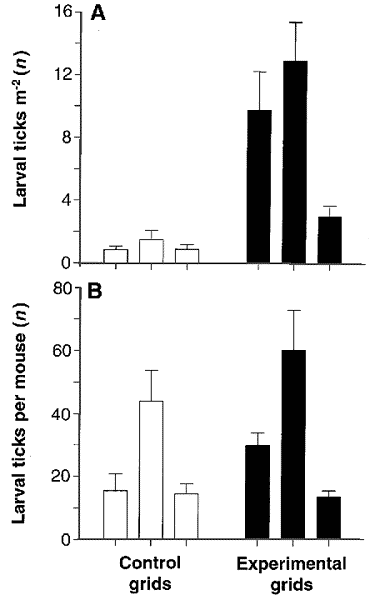
Figure 5C. Lyme disease tick densities on control areas (open bars) and experimental areas (solid bars) in August 1995 after acorn additions to experimental grids in October-November 1995. The bars show averages and the vertical lines are standard errors which are a statistical measure of the range of the replicates within each area. A is the number of host-seeking larval ticks per square meter. B is the number of larval ticks per mouse (from Jones, C. G., R. S. Ostfeld, M. P. Richard, E. M. Schauber, and J. O. Wolff. 1998. Chain reactions linking acorns to gypsy moth outbreaks and lyme disease risk. Science 279: 1023-1026).
For help, see the essay "Helping Your Students to Interpret Figures and Tables."

Figure 5A.
Average density per hectare (2.2 acres) of white-footed mice in 3 control (open circles) and 3 experimental (closed circles) areas. The vertical lines are standard
errors which are a statistical measure of the range of the 3 replicates. The data show (1) 1995 mouse densities before, during, and after mouse removal from the
experimental areas (black bar) from experimental areas duing the time when gypsy moths pupate (become larvae; white bar); (2) 1995 mouse densities before and
during addition of oak acorns (black arrows) to experimental areas in October-November 1995 when there were naturally few acorms produced by trees
in the control areas, and (3) 1996 mouse densities after acorn additions to experimental areas in 1995. Mouse densities typically go up when oaks produce
more acorns and they naturally decline in the winter (from Jones, C. G., R. S. Ostfeld, M. P. Richard, E. M. Schauber, and J. O. Wolff. 1998. Chain reactions
linking acorns to gypsy moth outbreaks and lyme disease risk. Science 279: 1023-1026).

Figure 5B.
Densities of gypsy moth life stages on or under burlap bands placed around trees in control areas (open bars) and experimental areas (solid bars) where
white-footed mice were removed. The bars show averages and the vertical lines standard errors which are a statistical measure of the range of the replicates within
each area. A is the number of living late-stage moths per tree just before mouse removal. B is the number of female pupae per tree successfully changing into
adults after mouse removal. C is the number of moth egg masses per tree after mouse removal (from Jones, C. G., R. S. Ostfeld, M. P. Richard, E. M. Schauber,
and J. O. Wolff. 1998. Chain reactions linking acorns to gypsy moth outbreaks and lyme disease risk. Science 279: 1023-1026).

Figure 5C.
Lyme disease tick densities on control areas (open bars) and experimental areas (solid bars) in August 1995 after acorn additions to experimental grids in
October-November 1995. The bars show averages and the vertical lines are standard errors which are a statistical measure of the range of the replicates within
each area. A is the number of host-seeking larval ticks per square meter. B is the number of larval ticks per mouse (from Jones, C. G., R. S. Ostfeld, M. P. Richard,
E. M. Schauber, and J. O. Wolff. 1998. Chain reactions linking acorns to gypsy moth outbreaks and lyme disease risk. Science 279: 1023-1026).