
Figure Set 4 homepage Carbon Sequestration in Agricultural Soils
Cognitive Skills: (see Bloom's Taxonomy) - knowledge, interpretation, synthesis
FIGURE SET

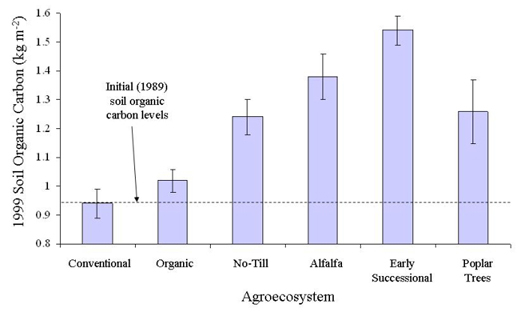
Figure 4. Soil organic carbon (SOC) levels in 1999 (kilograms per square meter) are shown for six experimental ecosystems in a long-term ecological research (LTER) experiment in southwest Michigan. Error bars represent standard error. Each Ecosystem Management treatment was initiated in 1989 and was replicated six times on randomly selected one hectare plots. The dashed line indicates average SOC for all treatments in 1989, when all treatments had similar SOC levels. Prior to 1989, the entire experimental area was farmed uniformly, where corn, soybeans and alfalfa were grown. Annual crops were harvested for agricultural production, alfalfa and poplar trees were harvested for biomass and the early successional community was left undisturbed, except for occasional spring burning to prevent colonization of tree species. Data to create Figure 4 was taken from Table 1 in Robertson et al. (2000), which is published in the journal 'Science.'