
Volume 6: Table of Contents
TEACHING ISSUES AND EXPERIMENTS IN ECOLOGY
The student active approach suggested here is "Turn to your Neighbor." This approach asks students to "turn to your neighbor" to discuss problems in small groups (2-4 students). Problems must be challenging to the degree that students will want to discuss it in groups, but not to the point that it becomes frustrating. We do not expect that students will have adequate background knowledge to answer all questions in this Figure Set. However, they should be able to come up with some well thought out responses. It is your responsibility as the teacher to stop the class after each question or set of questions (depending on whether students are more or less advanced) to discuss their answers and questions before moving on. Some questions are not directly related to the figure, but are important for the students to understand so that they connect soil carbon loss to climate change.
Depending on your area of expertise, this Figure Set may require you to do some background reading on the topics included. The resource section includes some references for this purpose, especially the suggested textbook (Schlesinger 1997). The questions will also require a substantial amount of interaction during class between the students and yourself. We've included a basic carbon cycle figure as Figure 1b for your general reference and as a potential handout for students.
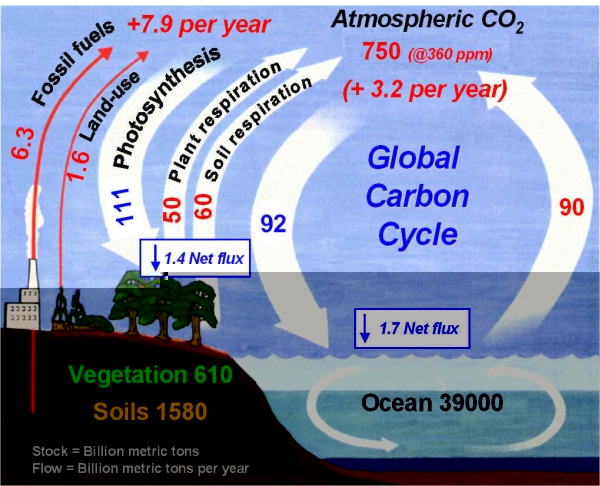
Figure 1b. The global carbon cycle includes pathways, fluxes and pools of carbon. Soils contain nearly three times more carbon than living vegetation. Photo courtesy of Dr. George Kling at the University of Michigan.
Prior to European colonization, prairies were the dominant plant communities in the Great Plains region of the United States. Settlers realized that these areas were very fertile and plowed up the prairies to plant crops such as corn, oats and wheat. After the first 40 years of cropping, approximately 40% of soil carbon was lost in the topsoil of an agricultural field in Hays, KS and 60% of soil carbon was lost in another field in Colby, KS. Figure 1a shows these trends in soil carbon from 1903-1946. Hays is in west, central Kansas while Colby is in the northwest corner of Kansas. Initial soil organic matter levels were lower in Colby than in Hays (see figure legend), which could help to explain the differences in total soil carbon lost during the study period. The data presented represent the average of a variety of crop rotations on soils not amended with fertilizers. Baseline data was collected from adjacent undisturbed prairie soils at the end of the study (1946).
These losses in soil carbon occurred because cultivation (tillage and periods of no plant growth) resulted in increased decomposition of soil organic carbon by soil organisms, such as bacteria and fungi. These soil organisms use the carbon for energy via cellular respiration, converting the organic carbon in soil to carbon dioxide in the atmosphere. Figure 1c provides a visual comparison of soils from an annually tilled field and a native tallgrass prairie. The color difference between soils is assumed to reflect the differences in organic carbon in these soils.
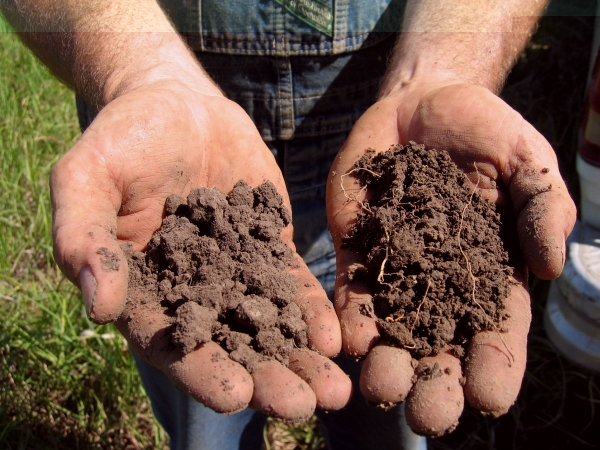
Figure 1c. Soils from two adjacent Kansas fields, an annually tilled agricultural field (left) and a native tallgrass prairie (right), are shown in palms of a research scientist. The soil from the native prairie is dark in color and contains substantial amounts of roots and soil aggregates whereas the soil from the tilled field is lighter in color, lacks roots and clumps together. Photo courtesy of Steve Culman, graduate student at Cornell University. (http://www.people.cornell.edu/pages/swc25/landinstitute.html)
Many students have trouble understanding the complete carbon cycle. This activity will take them step by step through the basics of the soil carbon cycle, from fixation of carbon by plants to decomposition by soil microorganisms. Simultaneously, they will learn that cultivation results in the loss of organic carbon from soil. The figure used in this set (Haas 1957) is fairly easy to comprehend and should not cause too much confusion. It simply outlines how much carbon is lost from soil during cultivation. Students are asked to examine the rate at which the carbon is lost through time, and to identify that carbon is lost from soil at a faster rate immediately after initiation of cultivation compared to later years of cultivation.
Students are asked to consider a series of five question sets. After each question set, the instructor should discuss the question with the class to make sure they understand the answers before proceeding to the next question. Notes for specific questions are listed below.
Warm Up Exercise
Students are asked to do some simple calculations to find out whether a farmer using horses for power or a carpenter driving to work every day is responsible for more carbon dioxide emissions during their lifetime. This activity is designed to make students realize that a substantial amount of carbon is lost from soil during cultivation, and to pique their interest in the topic before the rest of the activity. The idea is that they might start asking how so much carbon can be lost from soil during cultivation.
The farmer (Fred) is responsible for 1,250,000 kg of carbon released to the atmosphere from soil (50,000 kg C / ha x 50 ha x 50% soil carbon loss). The carpenter (Joe) is responsible for 124,800 kg of carbon released to the atmosphere from gasoline oxidation ((130 km x 200 days per year x 40 years) / 6 km per liter of gasoline x 0.72 kg carbon per liter of gasoline).
Question 1.
Students are asked to describe Figure 1a and explain what happened. They must understand the figure before moving on to the next questions. It is essential that the students understand that the rate of carbon loss from soil is greatest during the first several years after the initiation of cultivation, but the rate of carbon loss slows through time and the amount of soil carbon approaches a steady state. This may also be a good time to make sure that students correctly understand the definition of cultivation. Cultivation is agricultural production of food by preparing the land to grow crops and includes tillage, fertilization, planting, harvesting, and other methods of creating an optimal habitat for crop species.
The amount of soil carbon approaches a steady state through time. This new equilibrium occurs when inputs of new plant biomass are balanced by outputs through microbial respiration, and is a function of climate, soil characteristics, agronomic management and residue management.
Question 2.
Students are asked to consider where the soil carbon came from originally, and where it came from during the years of cultivation. Important points are as follows: (1) soil carbon comes from plant biomass that is fixed during photosynthesis (roots, shoots, root carbon exudation); (2) removal of crop biomass for food reduces the amount of carbon entering the soil and (3) carbon is stored in soil as dead plant material or dissolved organic carbon in soil water. One potential problem here is that students may just say 'crops' and really not understand the processes of how plant roots, etc. end up as particulate organic carbon and dissolved organic carbon. You may choose to introduce the term 'senescence' while discussing this topic.
Figure 1c and Figure 1d are presented here as optional figures to use in this activity. These figures are useful during classroom discussion of Question 2, as they highlight differences in root biomass between tilled and untilled fields, helping students understand why untilled crop fields retain soil carbon and tilled fields lose soil carbon. As the teacher, you may choose whether or not to use them in the discussion with your students.

Figure 1d. The soil profile can be seen for a perennial prairie plant on the left (intermediate wheatgrass - Thinopyrum intermedium) and annual wheat on the right (Triticum aestivum). Many roots can be seen underneath the intermediate wheatgrass plants. These roots, in addition to the shoots, will turn over at the end of the growing season resulting in the organic carbon inputs to the soil. Photo taken by Brook Wilke.
Question 3
Students consider what microorganisms live in soil and how they transform carbon. Important points for students to understand are that microorganisms utilize the potential energy in soil organic carbon via cellular respiration, and that the organic carbon is converted into carbon dioxide. A common misconception here is that students think the carbon is converted into energy, and thus disappears.
Question 4
Students consider why agricultural practices might result in increased microbial decomposition rates. These practices include tillage (Figure 1e), which increases oxygen concentrations in the soil and breaks up soil aggregates, which protect organic carbon from decomposers. Decomposition also continues to occur during periods of no plant growth, which are common in agricultural fields.
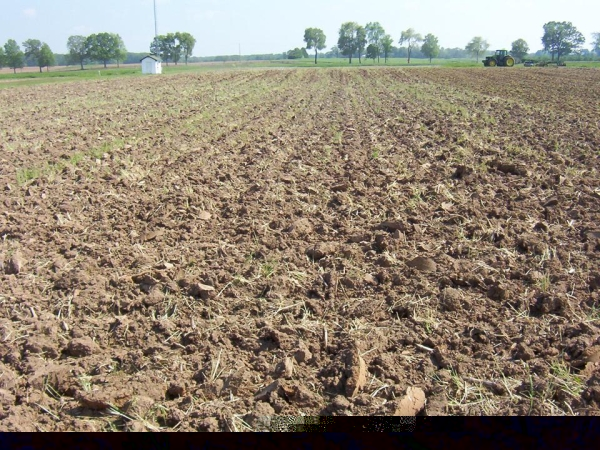
Figure 1e. Tillage in agriculture is a major disturbance to soil, breaking up soil aggregates and increasing the amount of oxygen available to aerobic decomposers. The field shown here has recently been tilled prior to spring planting. Photo taken by Brook Wilke
Question 5
To bring the lesson back to climate change, students are asked why carbon dioxide in the atmosphere is important to measure. They may need some guidance understanding the greenhouse effect. It may be beneficial to show them a graph of global atmospheric CO2 concentrations, such as those measured at Mauna Loa, Hawaii.
The optional short essay assessment below asks students to identify reasons for soil carbon loss after initiation of agriculture. They should be able to answer this essay based on the class discussions, as it requires little critical thinking beyond explaining what they've learned in class.
Post Lesson Assessment - Minute Paper (100-200 words):
Converting prairie soils to agricultural fields results in decreases in the amount of carbon that is stored in soil. Identify two reasons why soil organic carbon decreases after the initiation of agriculture (Consider how carbon enters the soil and how carbon leaves the soil).
An alternative assessment for smaller classes is listed below. Students are asked to use boxes and arrows to draw out the processes of soil carbon loss as they understand them. Students are given the components of the system and are asked to draw boxes and arrows, and to label the processes (arrows). You will need to explain how to do this in class. A basic example diagram that exhibits a correct student drawing is shown below in Figure 1f. You may want to use the carbon cycle in Figure 1b as an example for students, where arrows indicate processes and pools are indicated at the ends of arrows.
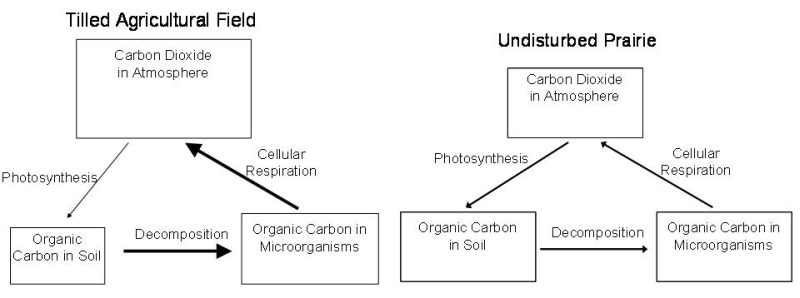
Figure 1f. An example box and arrow diagram is shown to illustrate the carbon cycle in an undisturbed prairie and a cultivated agricultural field. Student answers to the Post Lesson Assessment below could look similar to this. The agricultural diagram contains a larger box for atmospheric carbon dioxide and a smaller soil organic carbon box. Arrow sizes also change between the two scenarios. Created by Brook Wilke
Post Lesson Assessment: Box and Arrow Diagram:
As we have discussed in class, ecologists use box and arrow diagrams to show different parts of the carbon cycle, including sources and sinks for carbon. Use boxes and arrows to illustrate the carbon cycle in an undisturbed prairie and one that has been converted to a tilled agricultural field. Include the following as "boxes": organic carbon in the soil, organic matter in microorganisms, and carbon dioxide in the atmosphere. Label the processes (the arrows). Briefly explain each drawing.