VOLUME 6: Table of Contents
TEACHING ISSUES AND EXPERIMENTS IN ECOLOGY
TEACHING
ALL VOLUMES
SUBMIT WORK
SEARCH

Detailed Description of the Experiment (written for students)
Introduction
As loss of native habitat by human action reduces the total area of native habitat on the landscape, the remaining fragments of the native habitat (hereafter termed habitat fragments) shrink in area and become increasingly isolated from each other. Since reduction in total native habitat area and changes to habitat fragments are inextricably linked, "habitat fragmentation" has referred to (1) total habitat reduction and change to habitat fragments and (2) change to habitat fragments alone (Villard 2002). This experiment— and most of the recent literature— follows the second, more restrictive convention.
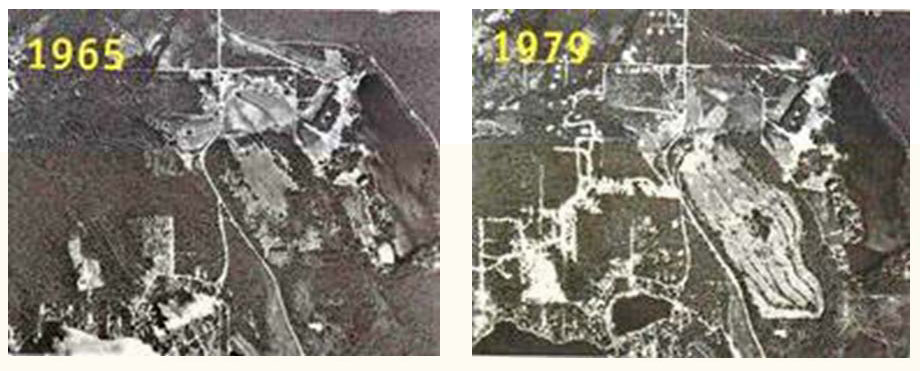
Figure 1. Aerial photographs of a landscape near Seattle, WA that was fragmented between 1965 and 1979. Note that native habitat fragments are smaller and more isolated in the latter image. These changes are hallmarks of habitat fragmentation.
Habitat fragmentation is an important ecological concept for two reasons:
- Many native terrestrial and wetland habitats are experiencing rapid rates of habitat loss and associated fragmentation. For example, the area of isolated forest in the Brazilian Amazon increased 317% between 1978 and 1988 (Skole and Tucker 1993) and the average forest fragment in metropolitan Seattle, WA shrank by 246ha between 1974 and 1998 (Robinson et al. 2005).
- Habitat loss, habitat fragmentation, and reduction in habitat quality (i.e., degradation) are the most common causes of species listing and proposed listing under the US Endangered Species Act (Flather et al. 1998, Wilcove et al. 1998) and the second most common cause of species endangerment in some developing countries (Li and Wilcove 2005).
The negative effects of fragmentation on native bird species in forests have been particularly well studied. As fragments decrease in area, the proportion of each fragment that is edge habitat increases. Edge habitat is situated within the focal habitat type, but close to its boundary. It tends to have more solar radiation, shrub density, nest predators, brood parasites, and cover of invasive non-native plant species than core habitat (i.e., non-edge habitat). Thus, all else being equal, rates of nest predation, brood parasitism, and bird species extinctions are often higher for small fragments with a large ratio of edge to core than for large fragments with a small ratio of edge to core (Wilcove 1985, Faaborg 2002). Many bird species are also negatively affected by fragment isolation, despite their ability to fly. As fragment isolation increases, the probabilities of colonization by a new species and rescue by an individual from a recently extirpated species decrease for all but species with greatest ability to disperse among habitat fragments (Belisle et al. 2001, Desrochers and Fortin 2000, Cooper and Walters 2002).
For the reasons described in the preceding paragraph, the largest and least isolated habitat fragments in a fragmented landscape often contain the largest number of bird species (i.e., species richness) and are often the focus of efforts to conserve regional biodiversity (Diamond 1975, Shafer 1997). Defining a fragment's conservation value with richness alone, however, has risks. Invasive species, species associated with edge habitat or human activity (i.e., synanthropic species), and native non-synanthropic species contribute equally to richness. Even if species classes are analyzed separately, they do not offer a straightforward means for calculating the values of fragment area and isolation where individuals tend to switch from present to absent. These values (i.e., management thresholds) are exceedingly useful to the natural resource managers and policy makers who decide which habitat fragments to protect. Assemblage nestedness is a useful alternative to species richness because it considers both species richness and identity and can produce management thresholds. Nestedness analyses use presence/absence data to determine if assemblages with x species richness tend to be found (i.e., nested) in assemblages with > x species richness.
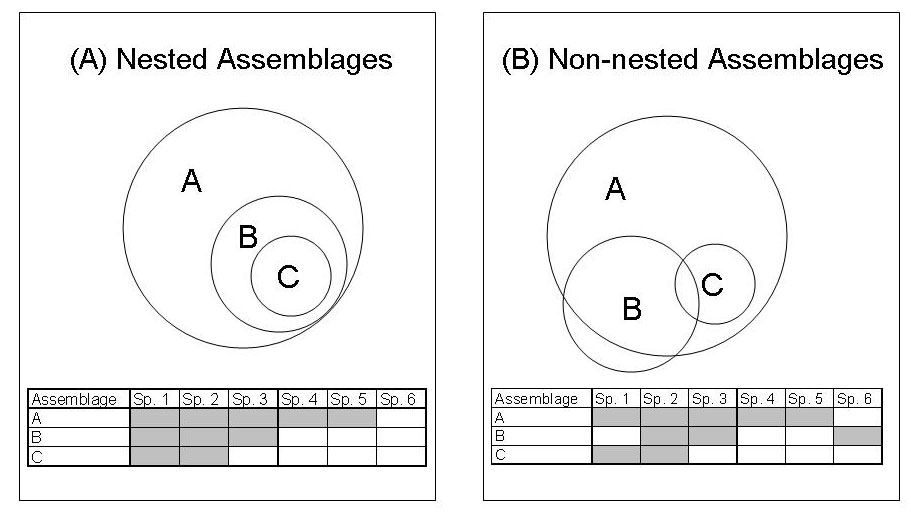
Figure 2. Venn diagrams illustrating the nested subset relationship. Modified with permission from Fleishman et al. 2007.
Each panel in Figure 2 represents a biota composed of three local assemblages, indicated by circles A, B, and C. Circle size is positively correlated with species richness. Greater area of circle overlap [i.e., intersection] denotes greater number of shared species. The left biota is nested; the species present in relatively species-poor assemblages are present in relatively species-rich assemblages. The right biota is non-nested because some species present in C are absent from B and some species present in B are absent from A.). More to the point at hand, this type of analysis can directly and statistically determine whether assemblages in habitat fragments are nested by fragment attributes (Fleishman et al. 2007).
For this exercise, pretend that you work for a county near your school that has a mandate and limited funds to conserve native species in forest fragments. Your supervisor has approved your request to test the hypothesis that breeding bird assemblages in your county are nested by habitat fragment area and isolation. You proceed by:
- estimating the size and isolation of several pre-selected regional fragments,
- surveying the fragments to determine which breeding bird species are present,
- testing whether assemblages are nested by fragment area and/or isolation,
- determining management thresholds with respect to fragment area and/or isolation (e.g., protection of fragments >2.1ha will conserve 72% native breeding bird species in regional species pool),
- and presenting your recommendations for conservation planning in the form of a scientific research poster.
<top>
Materials and Methods
Study Sites:
Obtain a spreadsheet from your instructor with the names and locations (i.e., latitude and longitude) of habitat fragments that you will use to test your hypothesis. Then, use software called GoogleEarth to locate those fragments and estimate their two-dimensional area and isolation. To get familiar with GoogleEarth, open the software and use the "fly to" tool in the upper left portion of the screen to find your school. Use the zoom tool on the upper right portion of the screen (you may have to roll the cursor over the tool for it to appear) to adjust your "height above the ground" so that the roof of your building fills most of the screen. Estimate the area of the roof using the "measure" tool and your knowledge of basic geometry. For example, if the roof is shaped like a rectangle, area equals the product of the lengths of two adjacent sides. Once you have checked your estimate of roof area with your instructor, use the latitude and longitude bar at the bottom of the screen and the measure tool to estimate the area of the habitat fragments described in the provided spreadsheet. After you estimate the area of a fragment, estimate its isolation before moving to the next fragment; this procedure will save you time. Estimate fragment isolation with the minimum straightline distance between a focal fragment and the nearest fragment of >10ha (equivalent to a circle with a 178m radius).
Overview of Data Collection and Analysis Methods:
Week 1, during lab
Take notes on habitat fragmentation, nestedness, the hypothesis, research group organization, and data collection methods. Form groups of three students.
Between Week 1 Lab and Week 2 Lab
Enter your estimates of fragment area and isolation into the spreadsheet provided by your instructor. Read two chapters by Faaborg (2002) on the effects of habitat fragmentation on breeding birds. Practice identifying breeding birds by sight and sound. Take a quiz on breeding bird identification
Weeks 2 through 4, during Lab
During each of these labs, you will travel to several forest fragments to survey birds. If the forest is fairly easy to walk through, survey birds using a transect (Bibby et al. 1992). You may stop periodically on the transect, but keep moving at a slow pace if possible. Identify all species detected by sight or sound within 30m of either side of the line. For a fragment less than roughly 8ha, the transect area (i.e., 60m swath centered on the line) should cover nearly all of the fragment without double sampling any area. For a larger fragment, the transect should cover a representative area at least as large as the area covered in smaller fragments. If the forest is difficult to walk through, survey birds with point counts (Bibby et al. 1992). At each point, remain still and silent for 1 minute, then identify all species detected within a 40m radius during the following 6 minutes. Follow the fragment coverage rules described for transects. Transects and points can be established prior to the visit using GoogleEarth and located in the field with a global positioning system unit. If possible, survey birds during the bird breeding season between sunrise and 4 hours after sunrise. Season is more important than time of day.
After the Last Lab
Add your group's bird survey data to that spreadsheet. This should be accomplished by adding a column for each bird detected within at least one fragment. Note the species' common name at the top of the column and indicate the presence or absence of the species in a fragment with a "1" or "0", respectively.

Figure 3. Format for entry of bird survey data into spreadsheet with site/fragment name, area, and isolation. Note that isolation is expressed as straightline km from the center of mass within the focal fragment to the center of mass in the nearest fragment that is >10ha.
To complete data formatting and statistical analysis, consult the instructions for using NestedSim.exe. If the value of %PN (i.e., your test statistic) is associated with a P-value less than or equal to 0.05, the assemblages are more nested than 95% of 1000 random simulation and the statistic is said to be significant. In other words, the high degree of nestedness is unlikely to have arisen by chance and your data support one of your hypothetical mechanisms. For each significant statistic/ assemblage, produce a spreadsheet showing species presence or absence in each fragment (i.e., presence/absence matrix) with a species occurrence threshold curve using the excel file named Threshold; for directions on how to operate the software, see the file's worksheet titled "instructions". The species occurrence threshold curve describes the line of smoothest transition between species-specific occurrence thresholds, or the value on a matrix's y-axis that is likely to divide presence of a given species from absence of that same species. Use this curve to extrapolate thresholds on the y-axis corresponding to conservation of 75, 50, and 25% of the regional pool of breeding bird species.
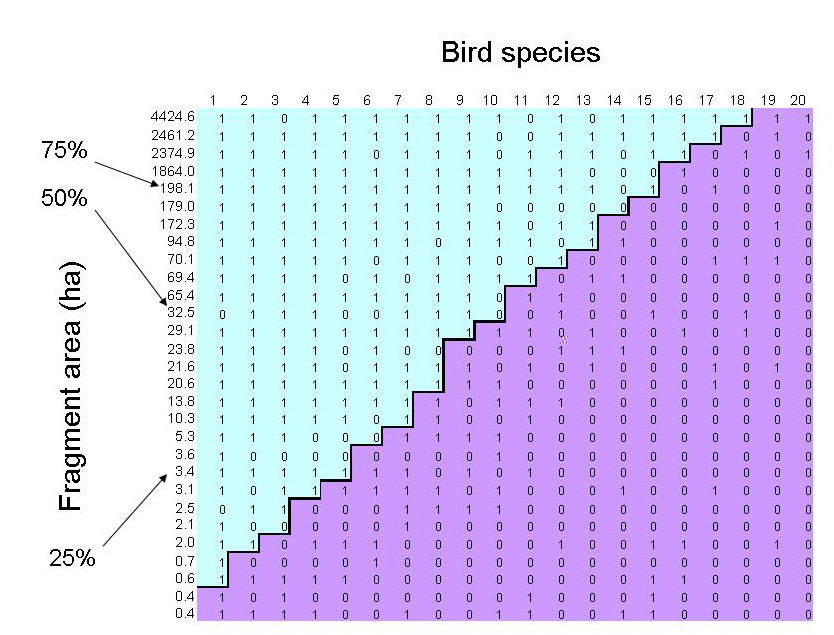
Figure 4. Output of program within excel file named threshold. The jagged line across the presence/absence matrix represents the species occurrence threshold curve. Notations indicate the minimum habitat fragment size predicted to contain different percentages of the regional pool of breeding bird species. For example, Fragments of at least 198.1ha will tend to support 75% [15/20] of the regional pool.
<top>
Questions for Further Thought and Discussion
- As mentioned earlier, the processes of habitat loss and habitat fragmentation are inextricably linked and have often been confused due to lack of standard terms. On which process do you think conservationists should focus? Why? (Search the literature for manuscripts by Henrik Andren and by Lenore Fahrig)
- Describe three ways that fragmentation decreases the potential for some species to successfully breed and occupy smaller and more isolated forest fragments. For a review, see Faaborg (2002).
- Why might species-specific dispersal ability or species-specific extinction probability produce nested assemblages of organisms in habitat fragments? Would you expect one of the mechanisms to explain nestedness of bird assemblages more often than the other? What other explanations for nestedness exist in the literature?
- If one explains assemblage nestedness in native habitat fragments with species-specific extinction probability, what must be assumed about the studied fragments prior to their separation from adjacent native habitat?
- What is the primary weakness of all presence/absence analyses and how might they affect conservation decisions emanating from those analyses? (Search the literature for recent manuscripts by Christina Vojta and by E. Fleishman)
- In the 1980's, conservation planners debated the relative merits of using limited funds to protect a single large fragment or a collection of several small fragments that have the same combined area as the large fragment. This debate is often referred to as the Single Large Or Several Small (SLOSS) debate. How might nestedness analysis bear on this debate?
- Assume that bird assemblages in your country's forest fragments are nested by fragment area. Would it be useful for you to study how fragment area leads to assemblage nestedness? In other words, would knowledge of the mechanism improve the outcomes of your management activities?
<top>
References and Links
- Belisle, M., A. Desrochers, and M-J. Fortin. 2001. Influence of forest cover on the movements of forest birds: a homing experiment. Ecology 82:1893-1904.
- Bibby, C., N.D. Burgess, and D.A. Hill. 1992. Bird Census Techniques. Academic Press, New York.
- Cooper, C.B. and J.R. Walters. 2002. Experimental evidence of disrupted dispersal causing decline of an Australian passerine in fragmented habitat. Conservation Biology 16:471-478.
- Desrochers, A. and M.-J. Fortin 2000. Understanding avian responses to forest boundaries: a case study with chickadee winter flocks. Oikos 91:376-384.
- Diamond, J.M. 1975. The island dilemma: Lessons of modern biogeographic studies for the design of natural reserves. Biological Conservation 7:129-146.
- Faaborg, J. 2002. Saving migrant birds: developing strategies for the future. University of Texas Press, Austin.
- Flather, C.H., M.S. Knowles, and I.A. Kendall. 1998. Threatened and Endangered Species Geography. Bioscience 48:365-376.
- Fleishman, E., R. Donnelly, J. Fay, and R. Reeves. 2007. Applications of nestedness analysis to conservation of biodiversity in developing landscapes. Journal of Landscape and Urban Planning 81:271-281.
- Li, Y. and D.S. Wilcove. 2005. Threats to vertebrate species in China and the United States. BioScience 55:147-153.
- Robinson, L., J. Newell, and J. Marzluff. 2005. Twenty-five years of sprawl in the Seattle region: growth management responses and implications for conservation. Landscape and Urban Planning 71:51-72.
- Shafer, C.L. 1997. Terrestrial nature reserve design at the urban/rural interface. In Conservation in highly fragmented landscapes (M.W. Schwartz, ed.), pp.345-378. Chapman and Hall, New York.
- Skole, D. and C. Tucker. 1993. Tropical deforestation and habitat fragmentation in the Amazon: Satellite data from 1978-1988. Science 260:1905-1910.
- Villard, M. 2002. Habitat fragmentation: major conservation issue or intellectual attractor? Ecological Applications 12:319-320.
- Wilcove, D.S. 1985. Nest predation in forest tracts and the decline of migratory songbirds. Ecology 66:1211-1214.
- Wilcove, D.S., D. Rothstein, J. Dubow, A. Phillips, and E. Losos. 1998. Quantifying threats to imperiled species in the United States. Bioscience 48:607-615.
<top>
Tools for Assessment of Student Learning Outcomes
This experiment proceeds in six stages that build upon one another. For the first two stages, each member of the group must submit independent work and will receive an independent grade. For the last four stages, all members of a group will receive the same grade. Here is a description of each stage:
- Prepare to identify birds by sight and sound in the field by studying for and taking a quiz. The quiz will test your knowledge of bird anatomy and song relevant to field identification. At least part of the quiz will take place outdoors.
- Read Faaborg (2002, chapters 4 and 5) to familiarize yourself with the well-documented effects of fragment size and isolation on bird species richness. Draft a report of about 1 page that summarizes the biological mechanisms underlying these fragmentation effects in your own words and links these effects to bird assemblage nestedness.
- Add the data on fragment area, fragment isolation, and bird species presence/absence to the spreadsheet provided by the instructors during the first lab. Your group will submit this spreadsheet twice. The first submission will be returned with comments on the accuracy with which you estimated fragment attributes. The second submission will be graded on your response to these comments, the inclusion of all bird presence/absence data, and the inclusion of a separate worksheet in the excel file that conforms to all of the formatting requirements for entry into program Nested (see the instructions for using NestedSim.exe).
- Test whether bird assemblages are nested with respect to fragment area and isolation using program Nested. Submit images of the computer output and all associated statistics calculated by hand (see the instructions for using NestedSim.exe).
- Prepare a scientific research poster on your experiment. The instructor will grade your poster based on the quality and relevance of information in each section (e.g., introduction), the clarity with which the poster communicates important concepts, and the ability of the group to answer questions posed by the instructor.
- Edit your rough draft poster using the comments from your rough draft. Your final draft of the poster will be graded on the degree to which you address prior comments and your ability to answer questions about your experiment posed by viewers at the poster session.
<top>