
VOLUME 4: Table of Contents
TEACHING ISSUES AND EXPERIMENTS IN ECOLOGY
As primary producers, plants form the foundation of terrestrial trophic pyramids in terrestrial ecosystems providing a source of nutrition, first, for primary consumers. These primary consumers called herbivores include invertebrates, primarily insects such as the larvae of butterflies, as well as some vertebrates, including mammalian herbivores such as white tailed deer.
The question of whether all plants provide food that is equally accessible to herbivores could be studied in light of the observation that plants produce a variety of secondary chemical compounds that cause plants to differ in their palatability to herbivores. An example of a secondary compound is capsaicin, the chemical that gives hot peppers their pungency. These compounds were called secondary compounds because they seem to play no role in primary metabolic pathways, e.g. photosynthetic pathways. Fraenkel (1959) suggested that these secondary compounds could serve a defensive role in plants, allowing plants to escape attack, to some extent, by herbivores. Ehrlich and Raven (1964) advanced the theory of coevolution in which they proposed that the great diversity of plants and herbivorous insects was a result of a process of stepwise evolution. This coevolutionary theory proposed that plants producing novel defensive chemical compounds could escape from herbivores for some time allowing the plants to diversify in species richness under conditions of reduced attack by herbivores, but some herbivore would then evolve the ability to detoxify the novel compounds of plants that had temporarily escaped from their herbivores. The ability to detoxify novel compounds would then allow herbivores to diversify in species number on the plants that had earlier escaped attack. This process of change in defensive chemistry in plants followed by change in the ability of herbivores to feed on these plants would continue in a co-evolutionary "arms race."
Many plants also have evolved physical defensive traits, aside from secondary compounds, that allow them to escape from herbivory. Such traits include spines and thorns, trichomes or hairs on leaves, and tough tissues that include highly indigestible compounds. With both chemical and physical defenses, plants can differ in their suitability as food for herbivores.
Herbivores have diversified to feed on plants and the different tissues produced by plants. Free-feeding insects live and feed on the exterior surface of plants. Typical free-feeding insects include defoliating insects that feed by chewing on plant tissue such as leaves; examples include larvae of butterflies and larvae and adults of many beetles, such as the Colorado potato beetle. Phloem feeders, such as aphids, use a mouthpart, adapted as a stylet, to tap into the sugar-rich fluid that flows through the plants phloem. Xylem feeders, such as spittle bugs, feed successfully on the nutritionally poor fluids that flow through a plant's xylem.
Endophytic insects, which are not free-feeders, are confined to, and develop within, a particular plant structure; such species include gall-forming insects and leaf miners. Gall-forming insects lay their eggs in plant tissue and induce the plant to produce a conspicuous protective structure, the gall, within which the juvenile insect feeds and develops. Gall-forming insects include species that chew on tissue within the gall as well as species of phloem-feeding aphids. Galls can be formed by different species of insects on leaves, petioles, buds, stems, or on flowers of particular plant species. Leaf miners are insects that produce larvae that develop within a leaf; the juvenile insects feed on the parenchyma cells within the leaf, creating a blotch or sinuous pattern characteristic of each mining insect species, where tissue has been removed. The mine can be seen on the surface of the leaf.
The diversity of herbivores, their feeding habits, the tissues that they feed on, and other elements of their biology result from the complex interactions between plants and the herbivores, as well as the enemies of the herbivores. Within a population of a given plant species there is variation in attack by herbivorous insects which has led to a variety of hypotheses to explain why some plants are more readily attacked by herbivores while other individuals in the same population experience lower levels of, or even escape, herbivore attack.
The tall goldenrod, Solidago altissima (Asteraceae), is a widely distributed fall-flowering species found in successional fields, prairies, or woodland edges throughout eastern and central north-America (synonymous with Solidago canadensis var. scabra (http://plants.usda.gov/ 2005)). The plant flowers in late summer into fall and produces many small seeds in each inflorescence that are evident on plants in early to late fall (Figure 1A and 1B).
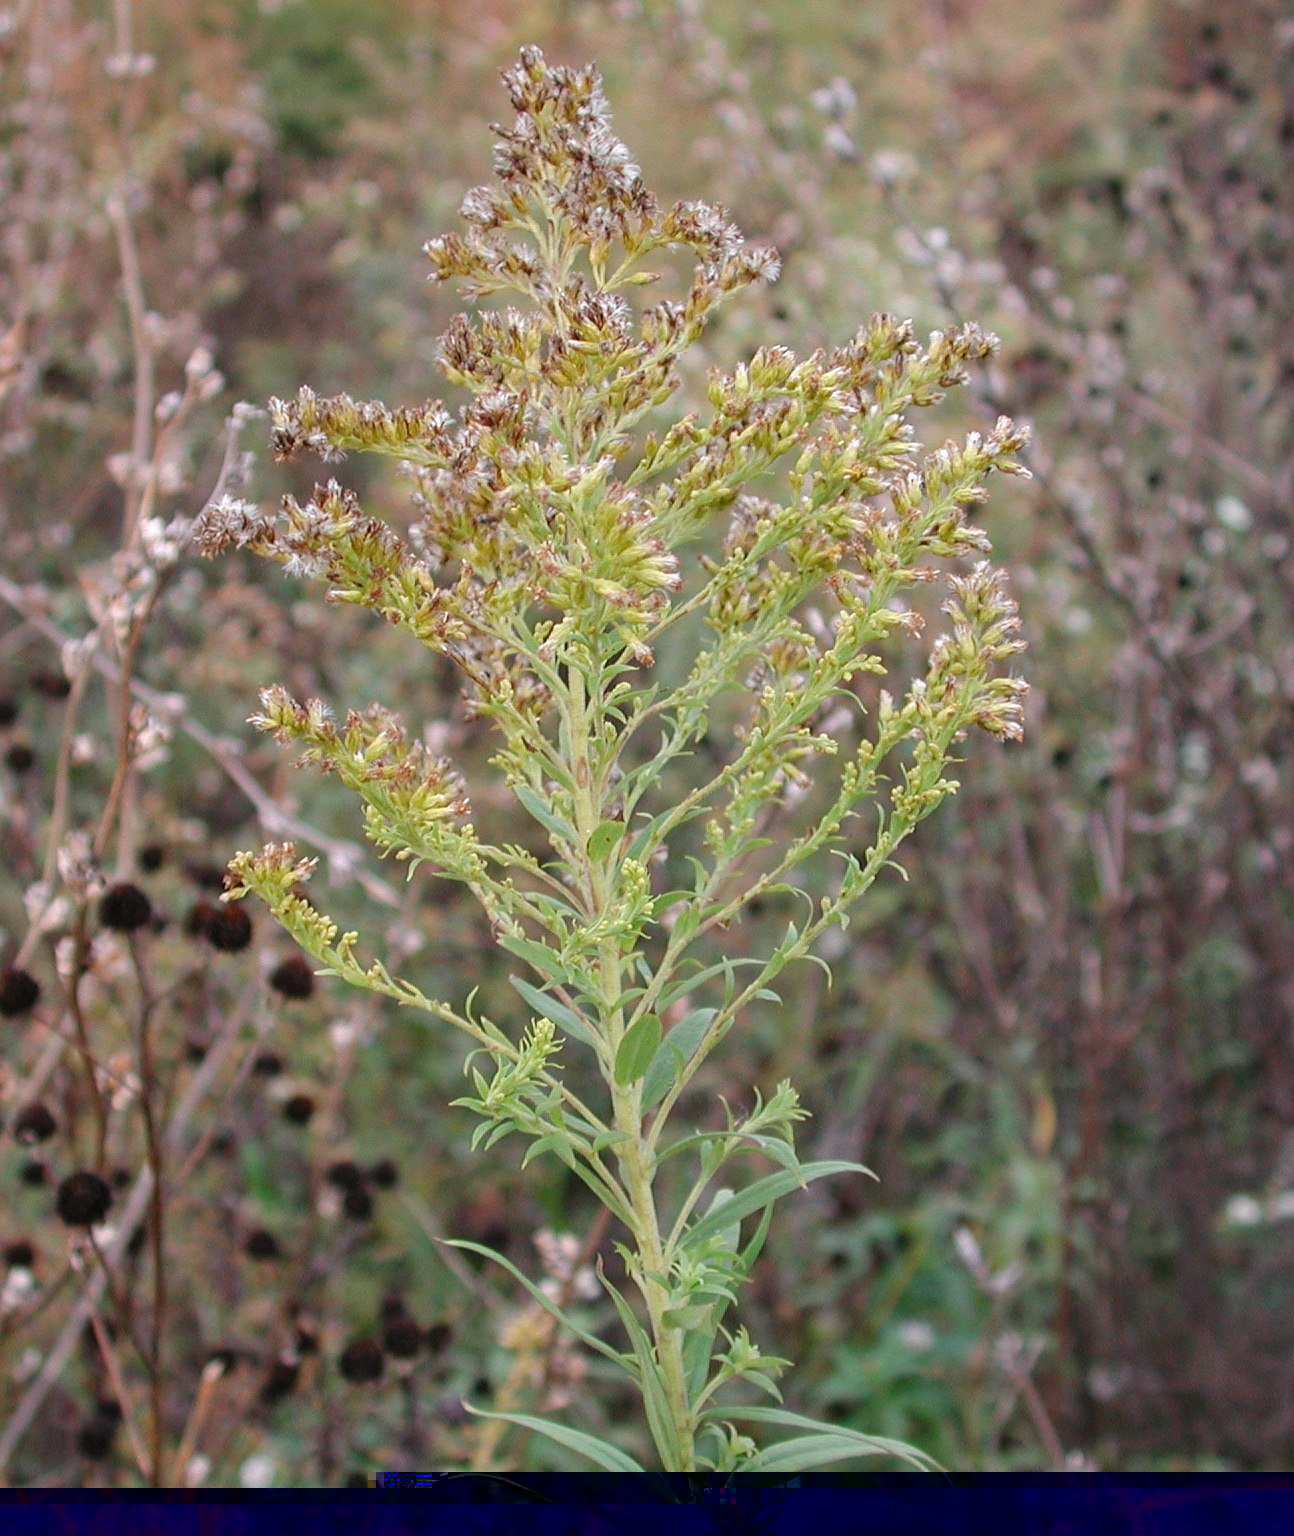 Figure 1A - late summer flowering tall goldenrod, Solidago altissima (Asteraceae) full size image |
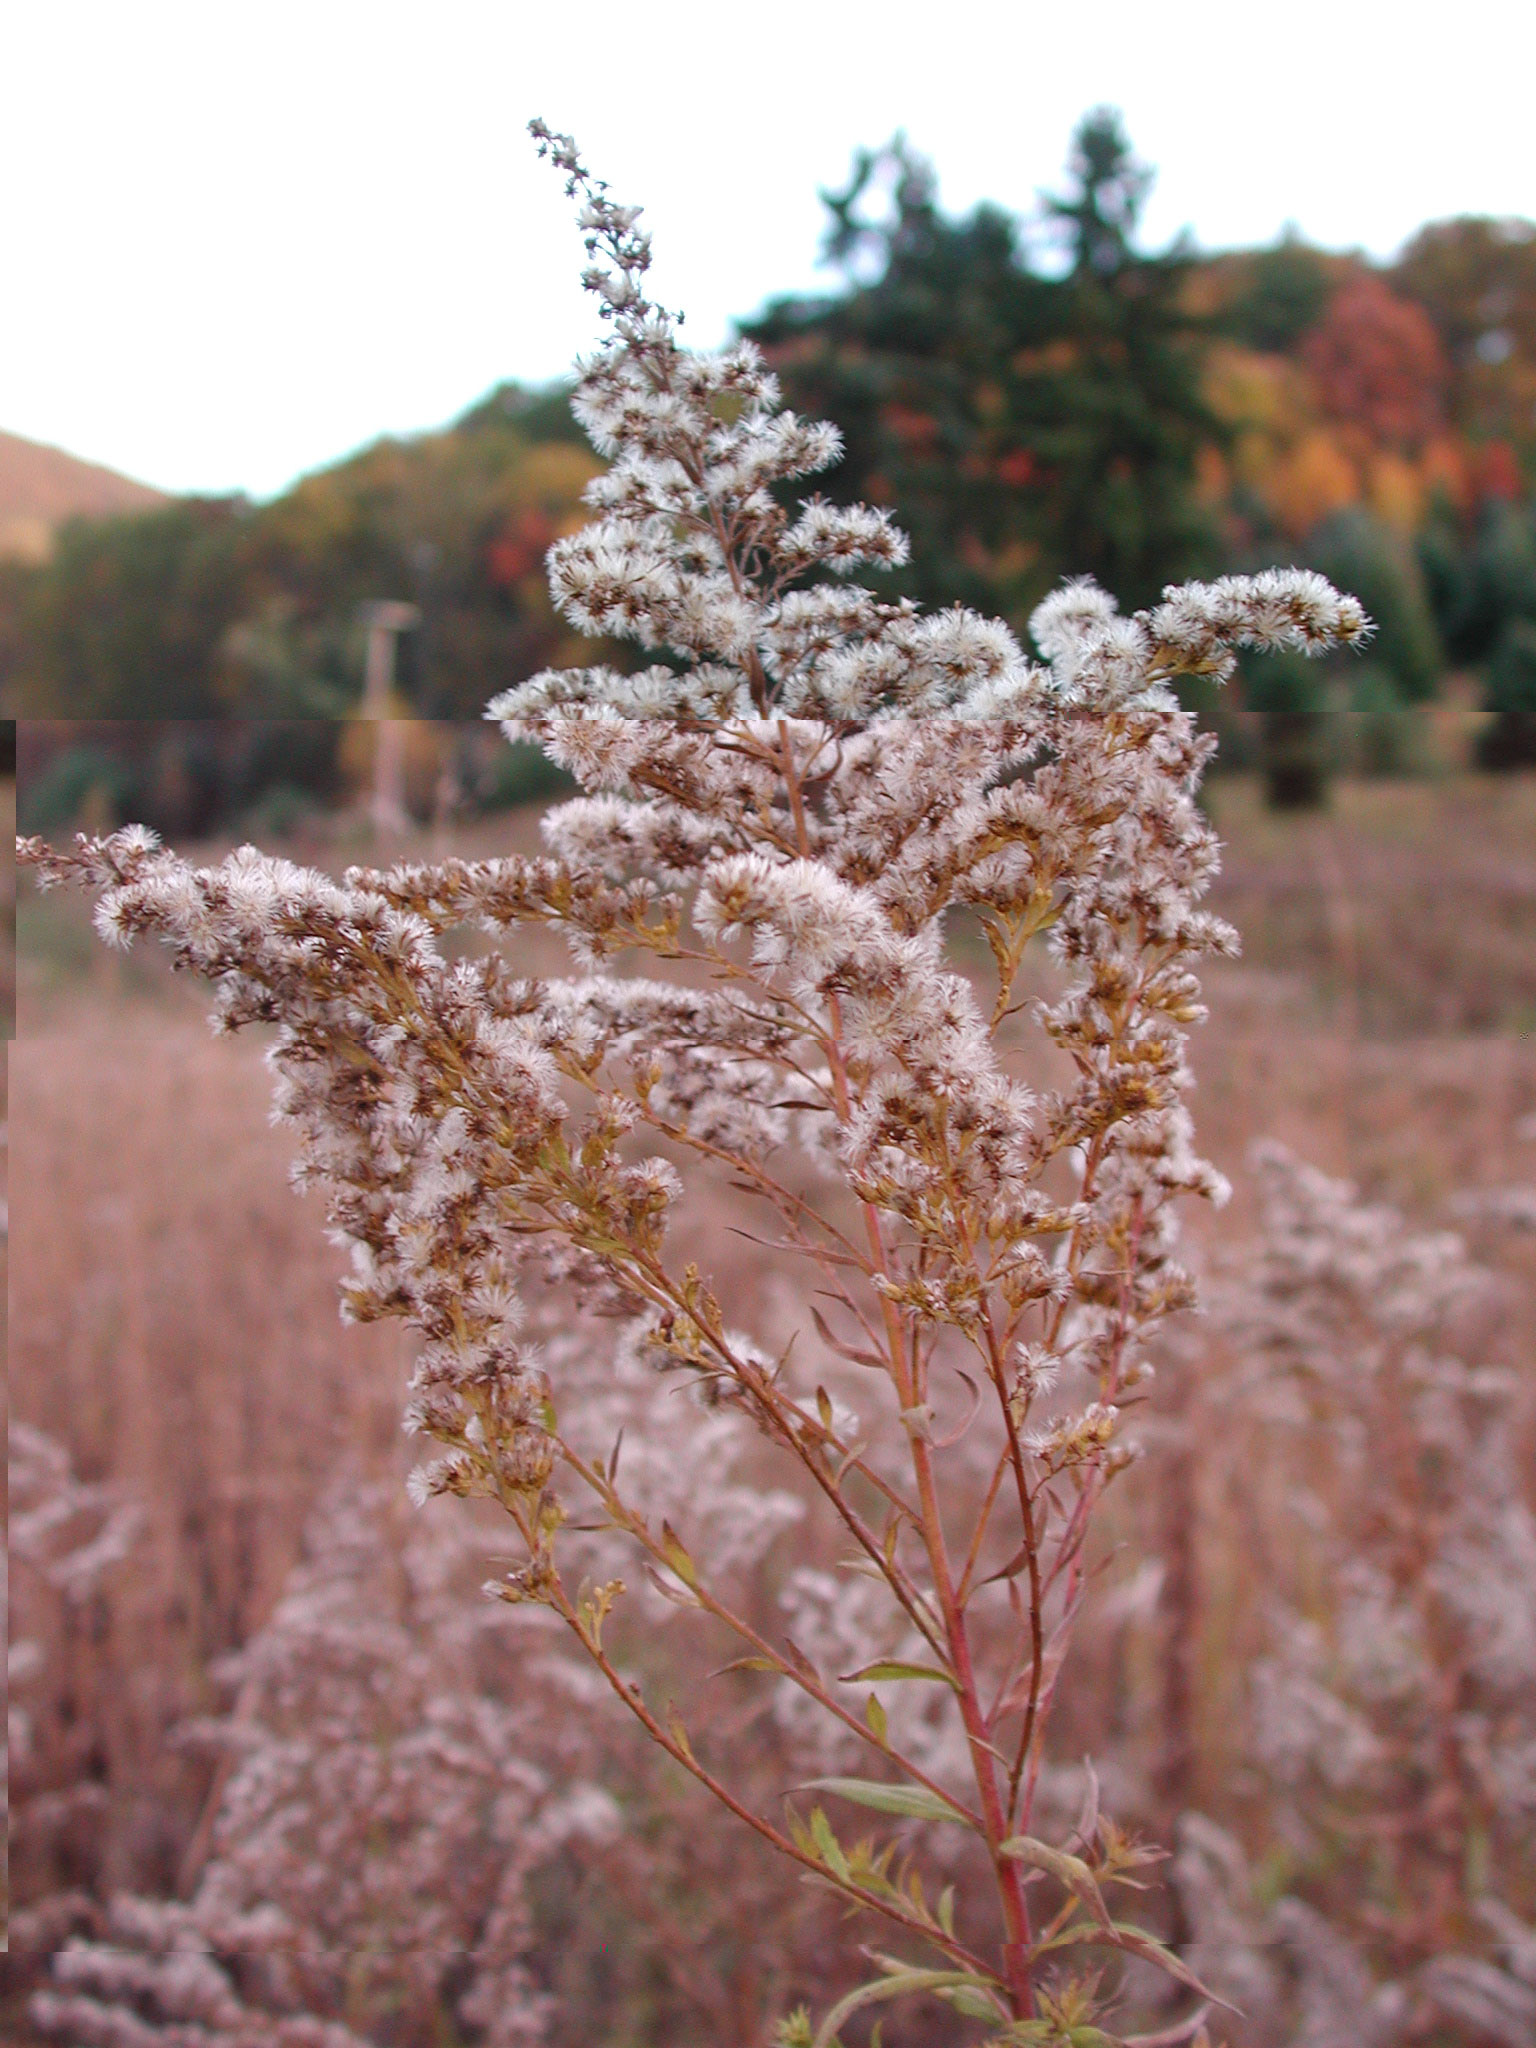 Figure 1B - Fall seed set by tall goldenrod, Solidago altissima (Asteraceae) full size image |
Stems of tall goldenrod are attacked by three different species of gall-forming insects. The gall forming insects and the names for the gall they form are: 1) Rhopalomyia solidaginis (Diptera: Cecidomyiidae) that forms the apical rosette gall (Figure 2A and 2B), 2) Eurosta solidaginis (Diptera: Tephritidae) that forms the goldenrod ball gall (Figure 2C) (Abrahamson et al. 1989), and 3) Gnorimoschema gallaesolidaginis (Lepidoptera: Gelechiidae) that forms the goldenrod spindle gall (Figure 2D) (for other images of these galls visit: http://www.cals.ncsu.edu/course/ent525/close/gallpix/ 2005). Either the rosette gall or the ball gall has been abundant enough to serve as the subject of this lab exercise. Following oviposition by the maternal insect in late spring, the ball gall and the rosette gall both begin to develop and become evident in early to mid-summer.
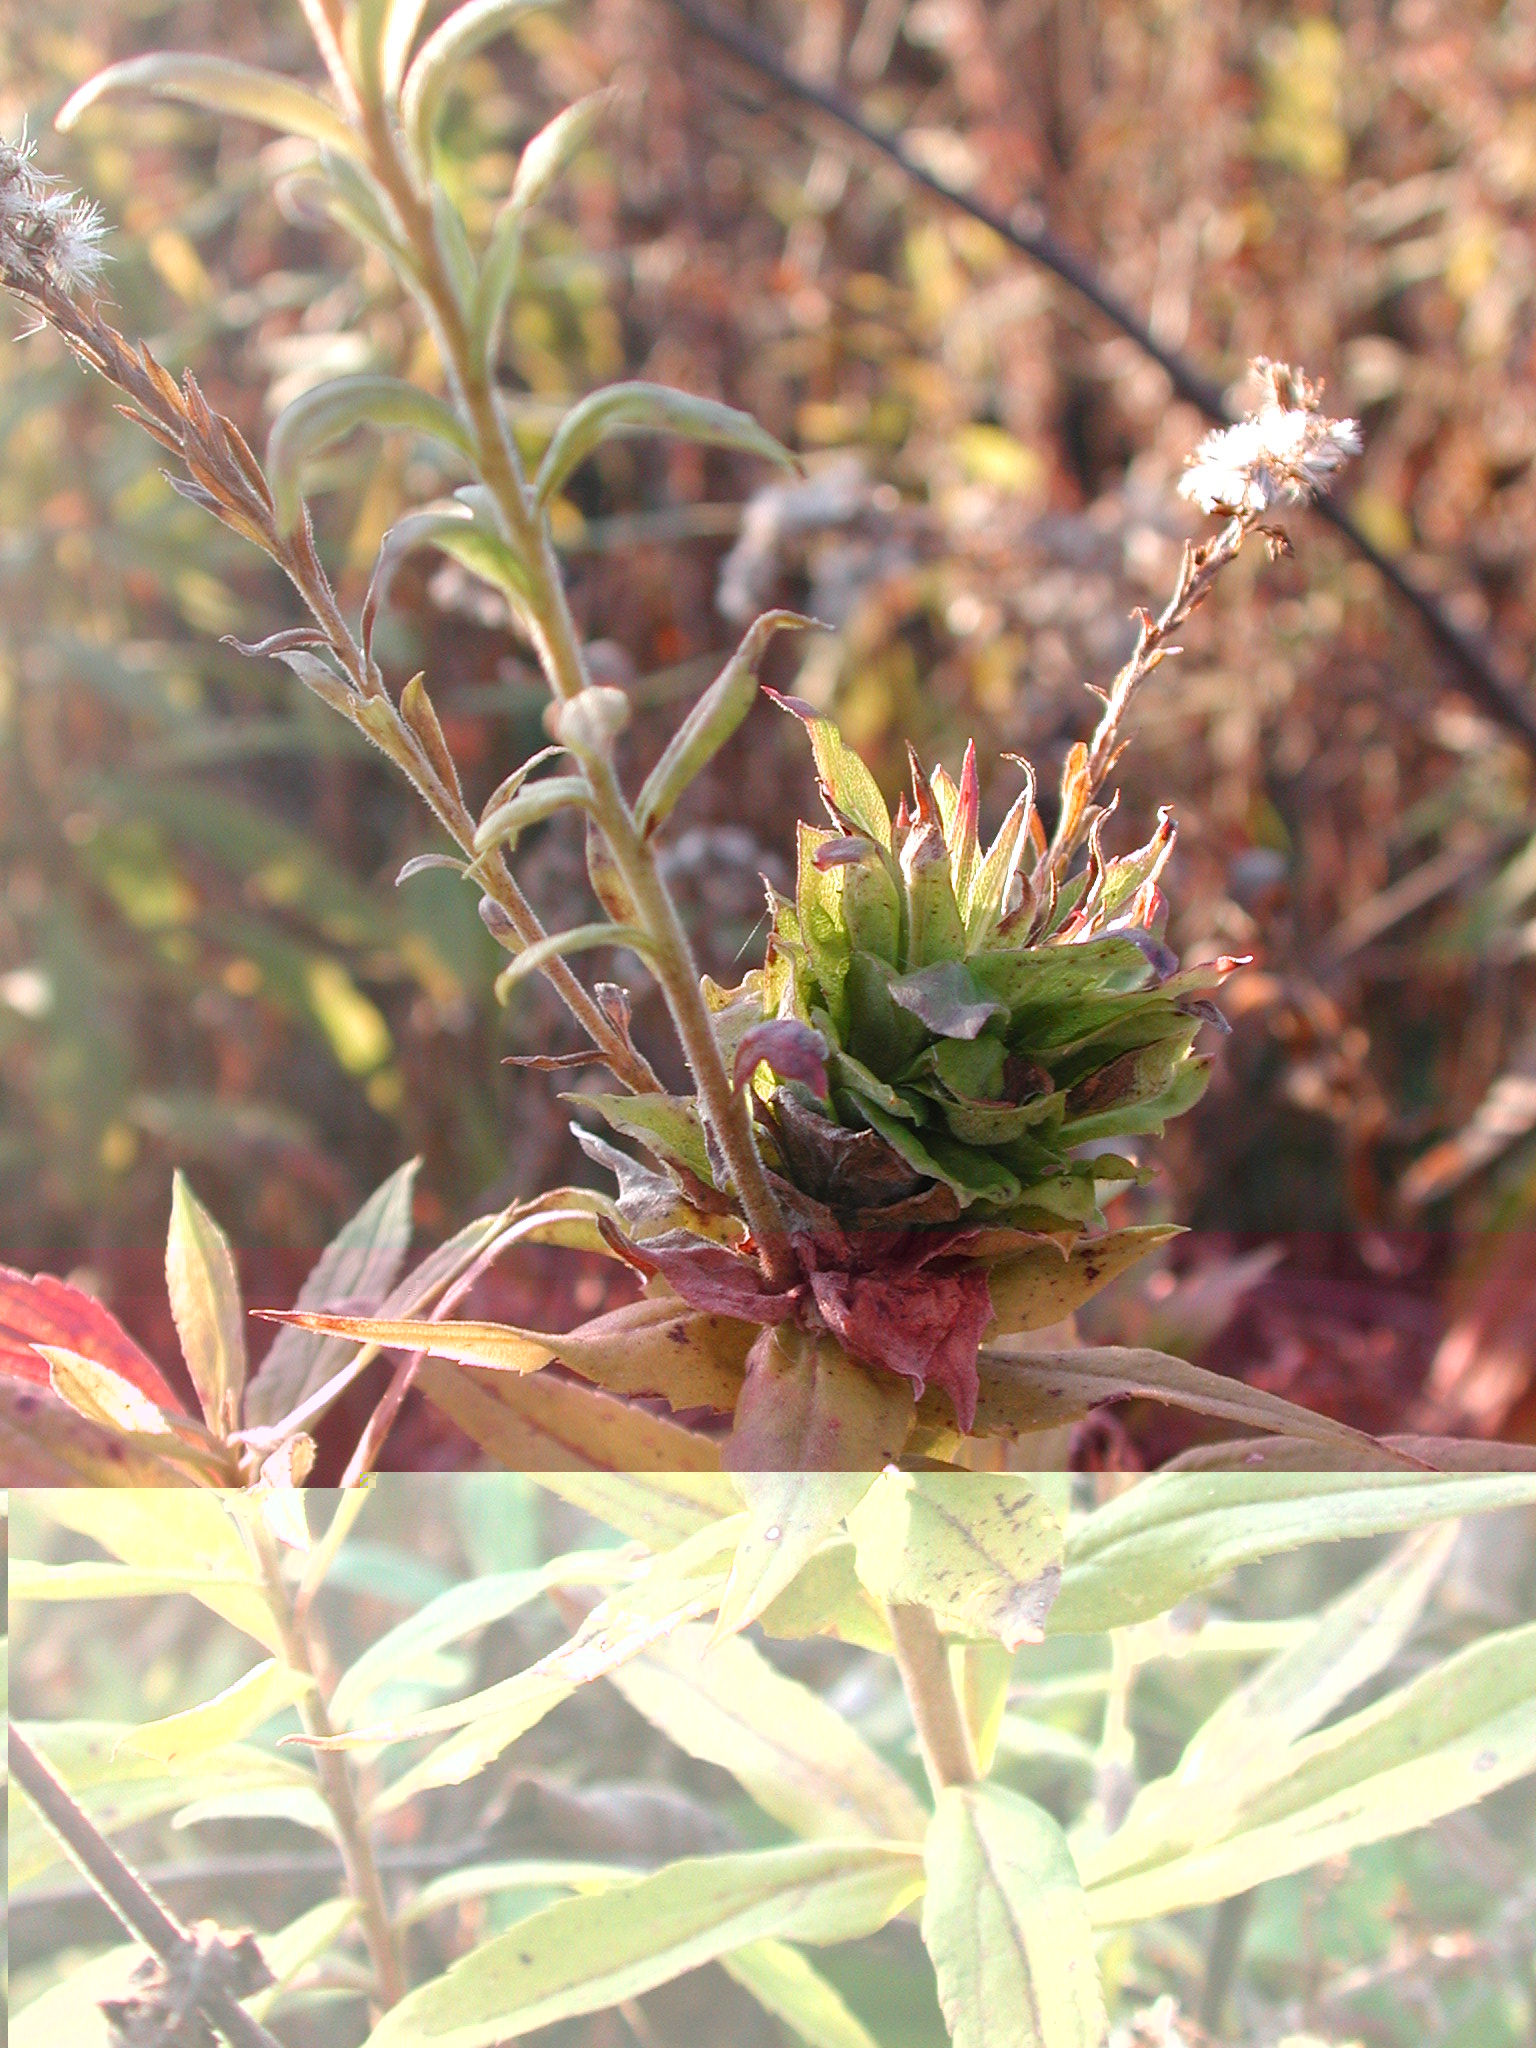 Figure 2A - Apical rosette gall formed by Rhopalomyia solidaginis (Diptera: Cecidomyiidae) on tall goldenrod, Solidago altissima (Asteraceae) full size image |
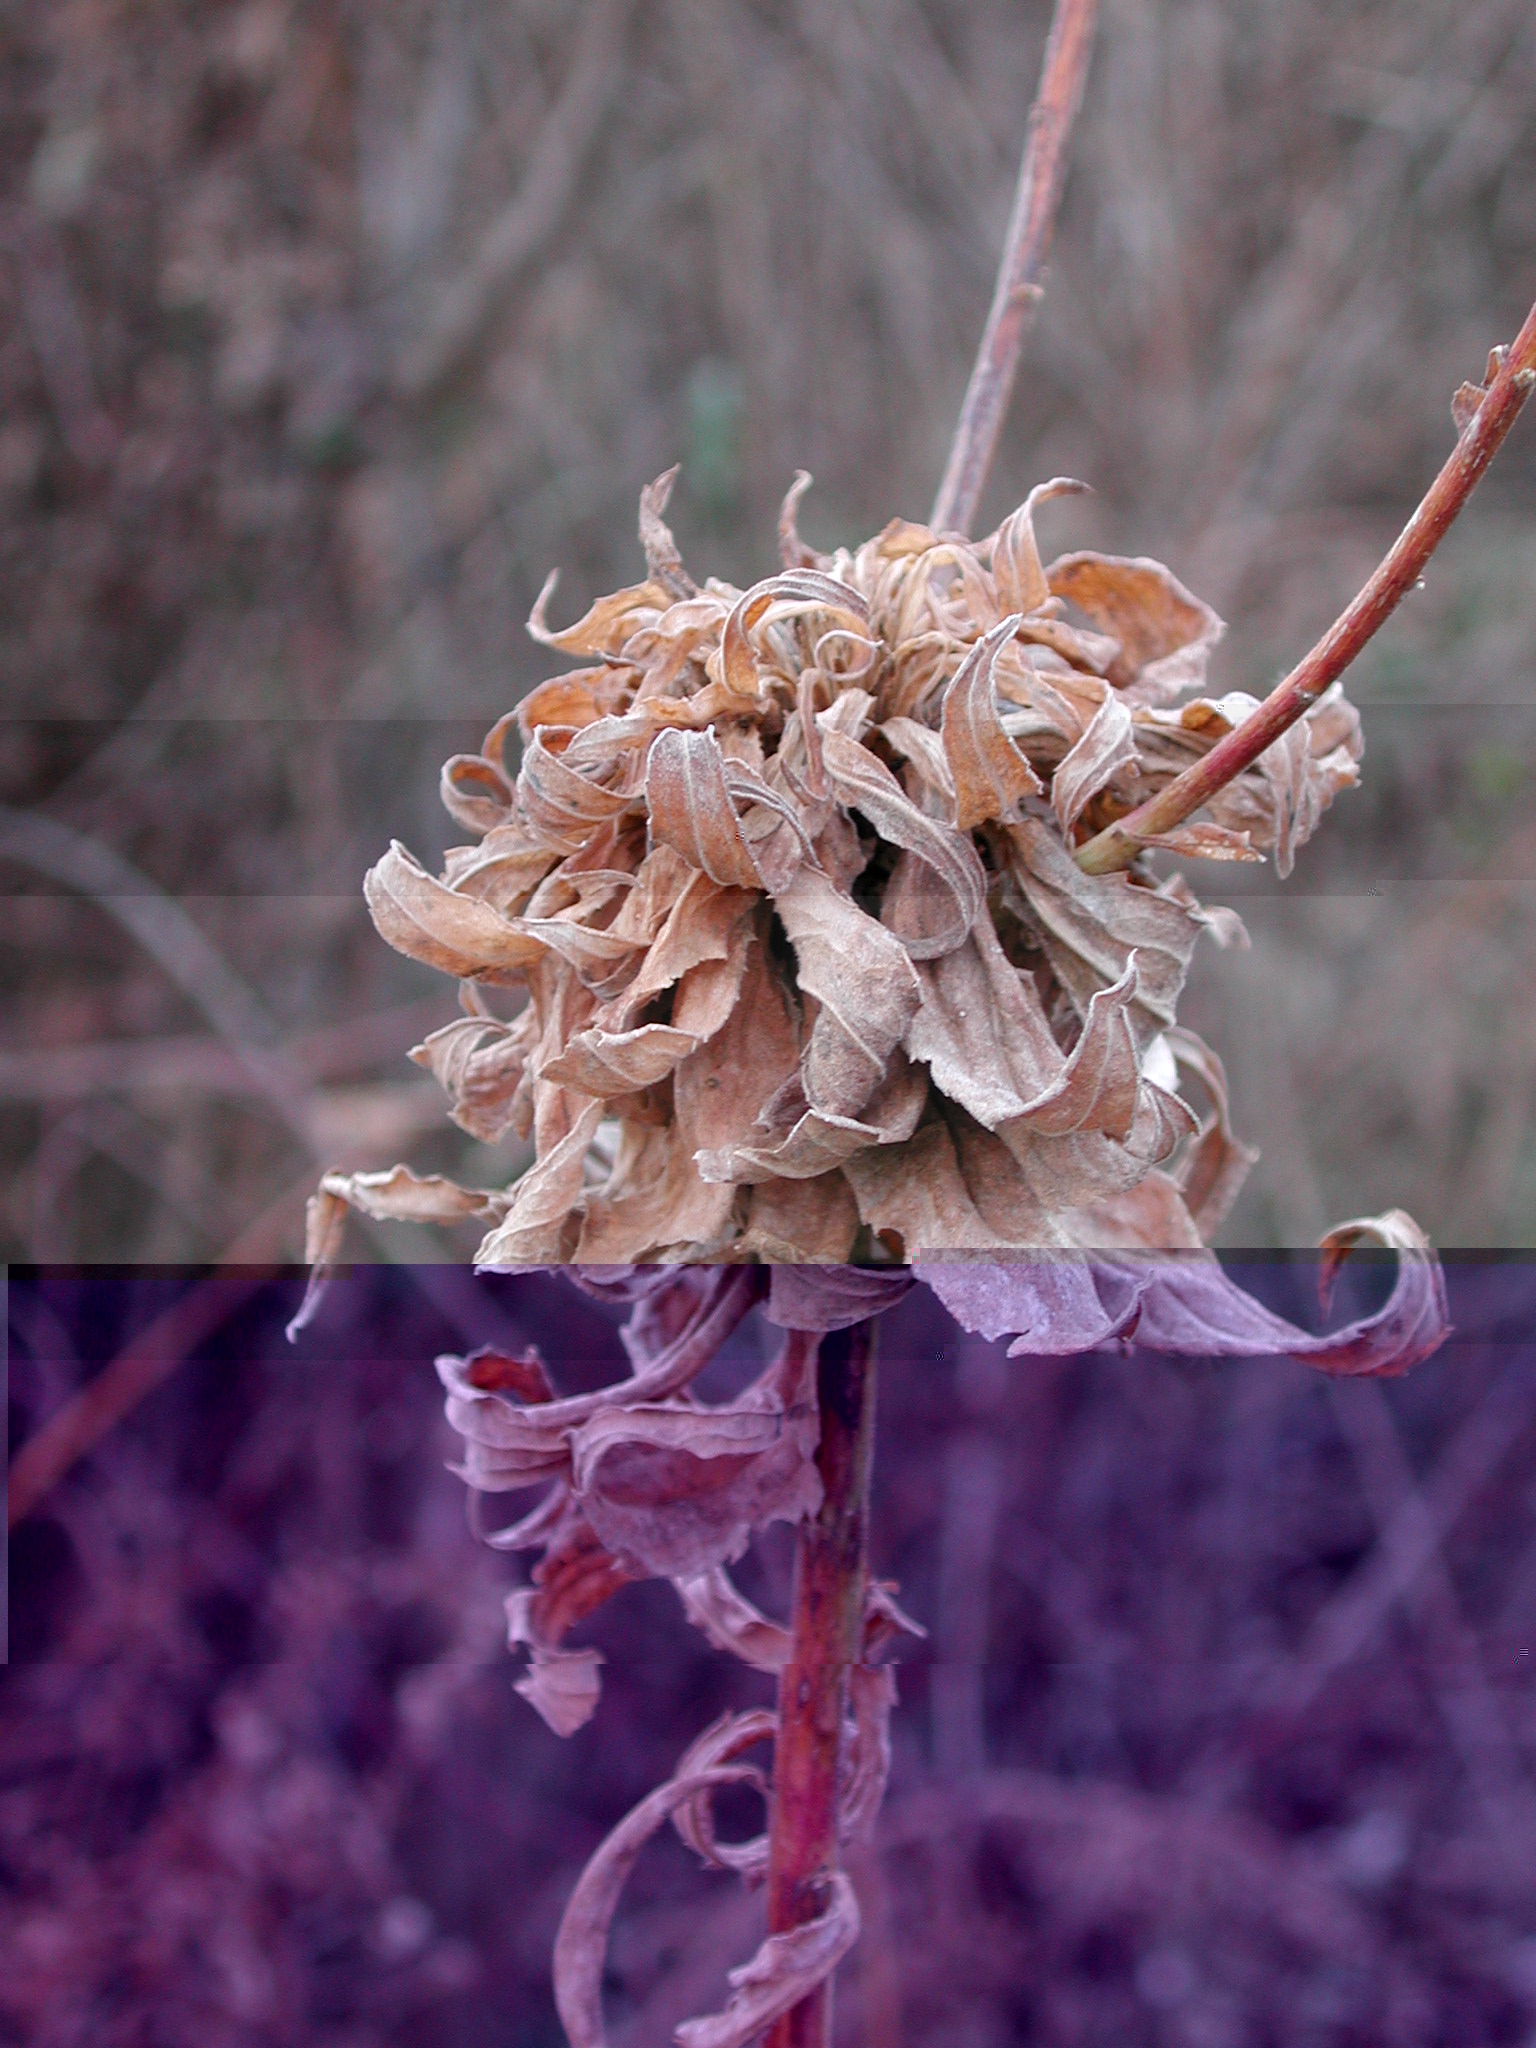 Figure 2B - Apical rosette gall as in Figure 1A, except in fall full size image | |
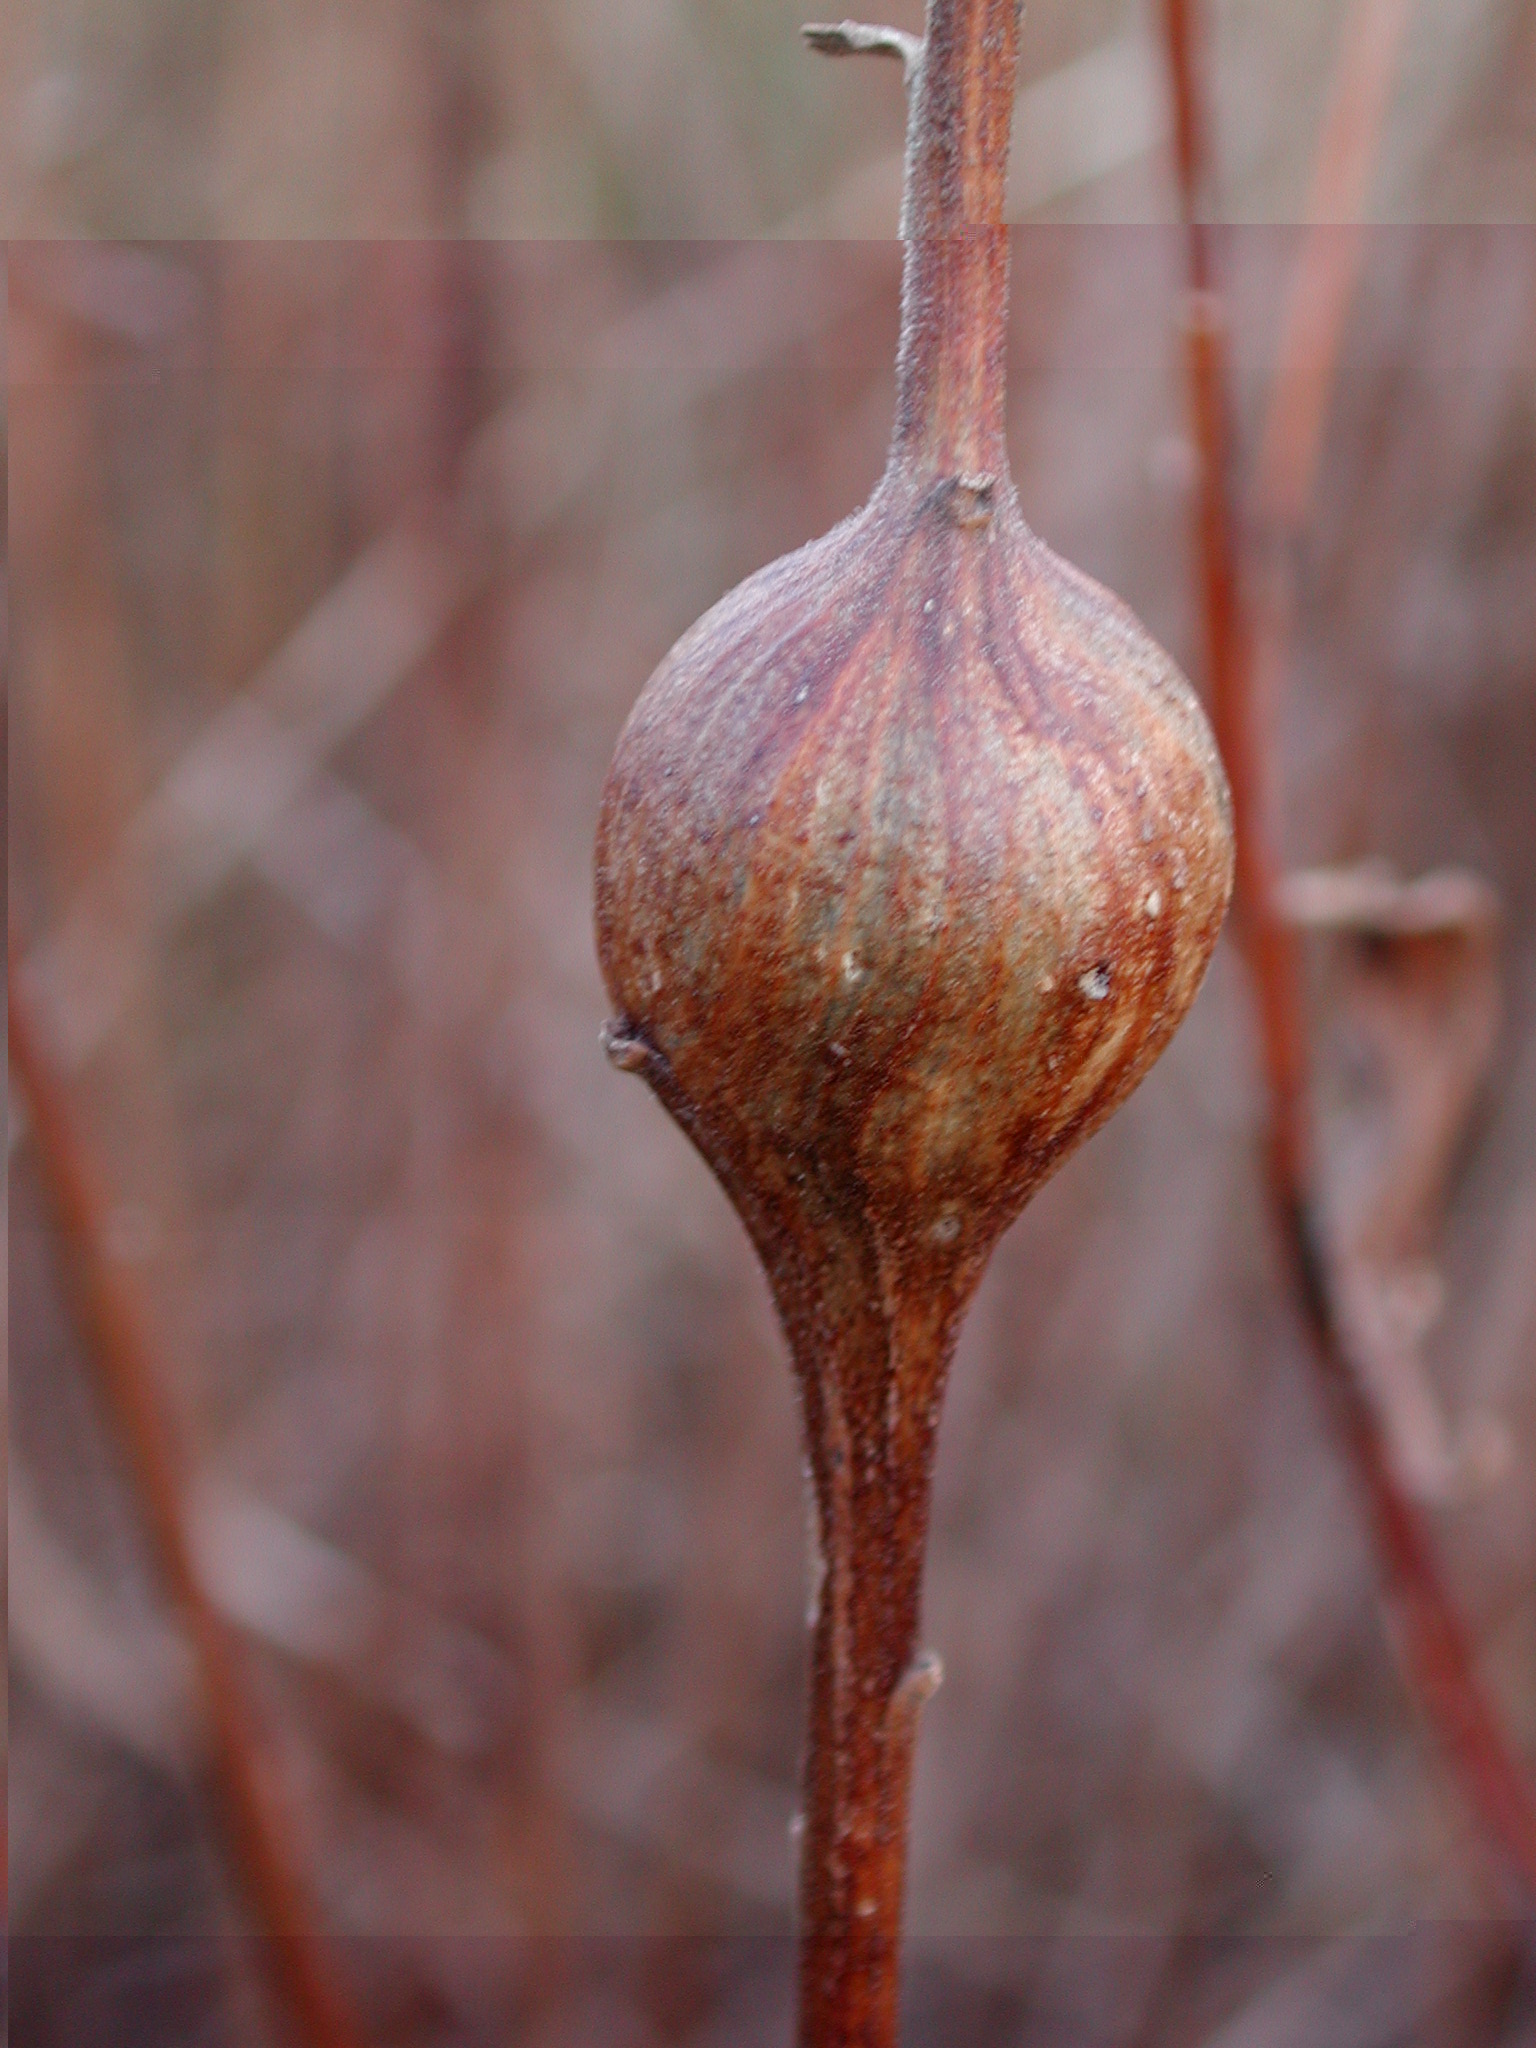 Figure 2C - Ball gall formed by Eurosta solidaginis (Diptera: Tephritidae) full size image | 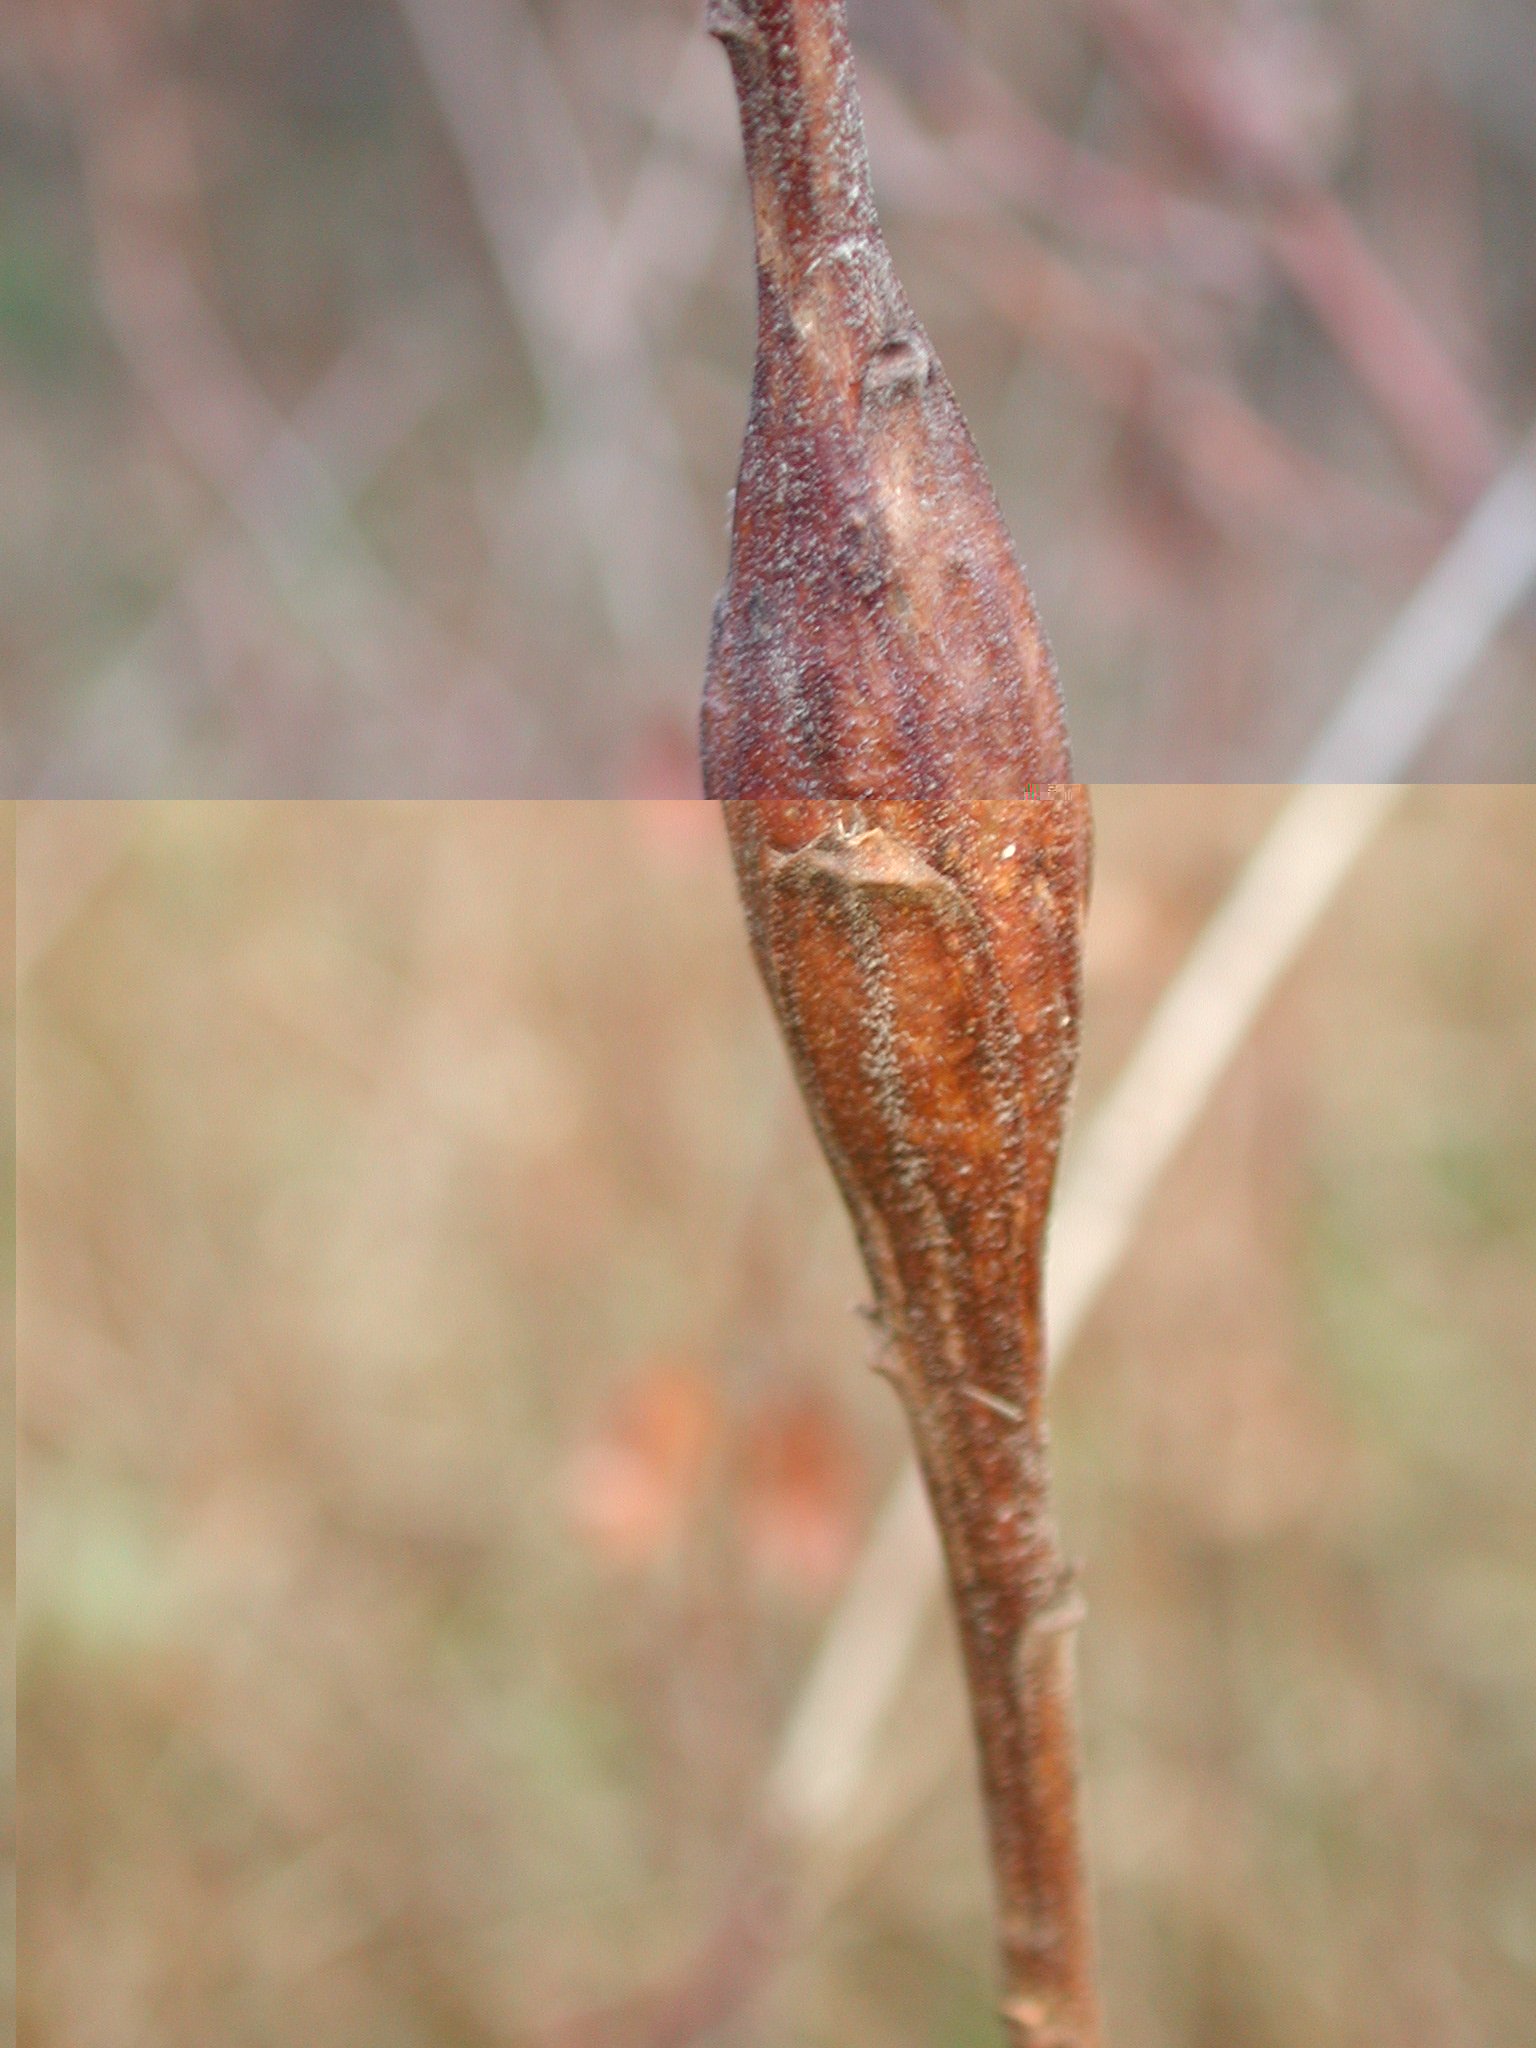 Figure 2D - Spindle gall formed by Gnorimoschema gallaesolidaginis (Lepidoptera: Gelechiidae) full size image |
Part 1: Gall-forming herbivores may improve their progeny's growth and potential for reproductive success by choosing to oviposit on individual plants of high nutritional quality. One hypothesis, the Plant Stress Hypothesis, proposed the idea that plants that were physiologically stressed as a result of lack of water would provide the best food for herbivores because these plants produced tissue that contained higher nutrient content, particularly nitrogenous compounds in the form of free amino acids (White 1993). This hypothesis suggested that plants exposed to drought might be more susceptible to herbivore attack; further, this susceptibility to herbivore attack might account for observed outbreaks of herbivorous insects often following periods of drought.
A second hypothesis, the Plant Vigor Hypothesis, proposed that herbivores should prefer healthy, vigorously growing plants that provide abundant nutrition to allow insects to feed and grow more rapidly (Price 1991). Plants growing in environments that provide abundant water and mineral nutrients and that provide access to appropriate levels of sunlight may grow more rapidly than plants that are deficient in any of these resources making such plants high in nutritional quality. There have been studies that have supported both hypotheses; some have shown that water-stressed plants are attacked most heavily by herbivores offering support for the Plant Stress Hypothesis (White 1984). Other studies have shown that plants of great vigor may support the highest survival and most vigorous growth of herbivores, lending support for the Plant Vigor Hypothesis (Craig et al. 1986).
Price (1991) suggested that the Plant Stress and Plant Vigor Hypotheses should not be seen as strict alternatives that would lead to one hypothesis winning out over the other, but rather as ends of a spectrum to account for the diversity of responses of herbivores to plants found in diverse natural systems.
Gall-forming herbivorous insects provide an interesting model for testing the response of insects to plants that differ in vigor. Insect-induced galls, or plant tumors, are structures on plants that are produced following oviposition by a female insect of a gall-forming species. In galling insects, it is hypothesized that each female chooses to oviposit on the plant tissue in which her offspring will feed and develop best; therefore the offspring, which develops to become a feeding individual, has virtually no choice about where it will feed. Following oviposition by galling insects, the plant produces a structure, a gall, within which the larval insect will feed and develop. Depending on the species of galling insect, the developing offspring will either leave the gall and pupate and complete its development outside of the gall, or it will pupate within the gall and will emerge from the gall as an adult and will mate after emergence, leading to continuation of the life cycle. It should be noted that the gall provides not only nutrition but also protection from enemies for the developing insect.
Part 2: In traditional theories about the evolution of plant defenses in response to herbivores, a central assumption was that herbivores would reduce the fitness, the reproductive success, of plants they feed on (Strong et al. 1984). The Negative Impact Hypothesis states that herbivores will lead to reduced reproductive success of plants that are fed on by insects. In recent years, researchers have suggested the Plant Tolerance Hypothesis, the idea that plants faced with herbivory may have evolved the ability to tolerate the loss of tissue that is either consumed by herbivores or allocated to galls. With tolerance, plants fed upon by herbivores will produce a similar number of seeds compared with plants that have not been attacked by herbivores (Strauss and Zangerl 2002). Finally, a third hypothesis about plant response to herbivores has been advanced. The Overcompensation Hypothesis proposes that plants attacked by herbivores are able to produce more flowers, fruits, and seeds than plants that have not been attacked by herbivores (Paige and Whitham 1987). The reproductive response of tolerant plants or of those that overcompensate may result from increased photosynthesis in plants attacked by herbivores, release of dormant meristems, reallocation of stored resources, or increased growth rate (Fornoni et al. 2003).
An hypothesis that predicts a full range of reproductive response by plants to herbivory is the Continuum of Response hypothesis (or Compensatory Continuum hypothesis), which predicts that depending on their access to needed resources as influenced by soil nutrients, water, or interspecific competition, plants may exhibit a negative, neutral, or overcompensatory response to herbivores (Maschinksi and Whitham 1989). Wise and Abrahamson (2005) presented the Limiting Resource Model as an alternative to the Compensatory Continuum hypothesis. This model contends that it more reliably predicts the range of observed effects of resource levels on tolerance by considering the resources that limit plant reproduction and the resources that are affected by particular herbivores.
Further, Plant Tolerance theory considers the range of reproductive responses of plants to herbivores, from negative, to neutral, to positive as indicators of differing levels of tolerance. This theory uses the term: a) incomplete tolerance when the effect of herbivores on plants is negative, b) complete tolerance when herbivores have no effect on plant fitness, and c) overcompensating tolerance when plants have higher reproduction following herbivory (Fornoni et al. 2003). For this lab, however, we will use the names for the three competing hypotheses that were introduced in the first paragraph, namely, Negative Impact, Plant Tolerance, and Overcompensation hypotheses.
Researchers today are actively engaged in studies of herbivore effects on plant reproduction to determine which of these three hypotheses is best supported by available data, or under what environmental conditions a particular hypothesis, and plant response, might be most appropriate.
You will visit an old-field site, a prairie site, a disturbed plot of land, or an infrequently mowed road edge or a park where a species of goldenrod, Solidago sp., grows (Figure 1A, 1B). In this site, you will locate a group of plants that support rosette galls (Figure 2A, 2B) or ball galls (Figure 2C), each of which can be abundant enough to allow this lab to be completed. The rosette gall is formed following oviposition by Rhopalomyia solidaginis, a Cecidomyiid fly, and the ball gall is formed after oviposition by Eurosta solidaginis, a Tephritid fly. In this lab, students should study plants that possess either rosette galls or ball galls, but not both. More information on goldenrod galls and gall identification can be found in some of the published papers and several of the websites devoted to study of goldenrod and gall formers; these papers and websites are cited in the References and Links section below.
The upper portion of the stem of tall goldenrod produces shoots that bear inflorescences that eventually produce seeds (Figure 1A, 1B). The galls you will study, or encounter, in this study include the rosette gall, (Figure 2A, 2B), the ball gall (Figure 2C), and the spindle gall (Figure 2D). However, the spindle gall has never been abundant enough in the goldenrod populations my students and I have worked in to use it as a subject of study in this lab exercise.
Overview: First, you will survey the goldenrod population to document the proportion of stems within the population that are galled. This will suggest whether herbivores are abundant and have the potential to be an important ecological force within this system. Second, students will then make a preliminary test of the Plant Vigor Hypothesis, which predicts that vigorously growing plants will be galled at a higher rate than more stressed, less vigorous plants. Attack of less vigorous plant parts would lend support to the Plant Stress Hypothesis. In this exercise, the size of the plant part attacked by the gall-forming insect is considered as an indicator of vigor. Last, you will test the hypothesis that the rosette gall or the ball gall has a negative, positive, or no impact on goldenrod reproduction.
Procedure 1: Proportion of plants galled. In order to objectively assess the proportion of goldenrod stems that are attacked by rosette or ball galls within the goldenrod plant population, you will (as a class) use a belt transect method to survey approximately 1000 stems and to classify them as either galled (stem possesses the gall of interest) or ungalled. (Be aware that there are at least three species of stem gall formers on goldenrod; if you encounter any odd looking galls, you may want to note that the plant is galled but you should note the identity of the other type of gall). You will only count and record the number of stems that are galled or not galled by the gall-former species you have chosen for study. Your instructor will help with identifying the rosette gall, the ball gall, or a third gall, the spindle gall. Students may want to create a reference collection that includes one named sample of each type of gall taped to an index card, to aid in identification of galls along the transect. This reference collection can be used to help in identification of any galls that are not fully developed or to be certain of consistency of identification among all student groups.
1) Belt Transect (Figure 3): Each group should run a 30 meter transect in the field selected for study; place a flag, or tie flagging tape to a stem, at every 5m increment along the meter tape; you can lay the 30m portion of the tape on the ground to mark one boundary of your belt transect. You will sample from within a 0.5m wide belt that runs alongside the meter tape; you can use two additional flags to mark the corners of each 5m x 0.5m sampling increment along the belt transect. You can flip a coin to determine if you will run the belt sample along the left side or the right side of the meter tape. In the belt of 0.5m on one side of the transect, for each five meter increment on the transect, you will count and classify the first 40 stems that you encounter in that 5m x 0.5m belt. Then, survey the next 5m belt. In so doing, each group should survey 240 stems; each group can typically find 240 stems to survey within the 30m belt transect. With at least four groups collecting and sharing data, you will have data on the proportion of stems attacked for 960 stems. You can plot these data as proportion of stems attacked or not attacked on a graph; no statistical test is performed using these data.
|
Figure 3. Illustration of belt transect that is 30m in length and 0.5m in width. Goldenrod will be sampled for the presence or absence of galls and for size and reproductive attributes within each 5m x 0.5m segment of the belt transect.
|
Procedure 2: Plant vigor hypothesis and herbivore impact on plant hypothesis: Within each lab group, while you are surveying plants for the proportion of stems with galls along the transect, mark 15 galled stems for later measurement. For each of these galled stems, mark the nearest ungalled stem. An objective way to sample galled stems is to choose the first three galled stems that you encounter in each 5m x 0.5m portion of the belt transect. (Can you think of other ways to select galled stems in an objective or randomized manner?) You should strive to select galled stems, and the paired ungalled stem for each galled stem, from along the length of the entire belt transect, e.g. choose about three galled stems per 5m portion of the belt transect. These galled and ungalled stems can be anywhere within the belt transect. A flag or flagging tape can be used to mark the matched galled and ungalled stems.
Plant Vigor vs Plant Stress: For each marked stem, note if it is galled or ungalled, measure the total height, in cm, of the stem with the gall on it (to the tip of the tallest branch); straighten out the longest stem if it is drooping. You will use the height data to examine the Plant Vigor Hypothesis and the Plant Stress Hypothesis by comparing galled and ungalled stems. With four groups, each measuring 15 pairs of stems, the group should have data on 60 pairs of stems; allowing for a fairly rigorous statistical test. The mean value for the height of the galled and ungalled stems should be plotted; consider the most appropriate type of statistical test that you might use for data that has been collected from two nearby stems, i.e. paired samples (data for stem height is collected from pairs of galled and ungalled stems) (see Statistics Appendix [57k *.doc] or [35k *.pdf]).
Procedure 3: Plant Reproduction: Herbivore Impact vs Tolerance vs Overcompensation: For each marked stem, note if it is galled or ungalled. For each marked galled and ungalled stem, count the number of every inflorescence-bearing shoot. You will then measure the length, in cm, of every inflorescence-bearing shoot at the end of each galled or ungalled stem on the plant. You should measure the portion of the stem from the location of the first inflorescence to the end of the stem where the last inflorescence is located. Provide the sum of the lengths of all stems with inflorescences at the end of the galled or ungalled stem. We will assume that the length of the inflorescence is correlated with seed production. Is this a reasonable assumption? Is this a testable assumption? You can plot the total mean length of galled and ungalled stems bearing inflorescences after summing all the lengths of all the stems that had inflorescences on them for each galled and ungalled plant. You can test whether the ungalled stems differed from the galled stems in the "number" of inflorescences or seeds they produced as measured by the length of the inflorescence bearing stems. You can perform a statistical test for paired samples to compare the length of inflorescences on galled vs. ungalled plants (see Statistics Appendix [57k *.doc] or [35k *.pdf]).
Measuring Reproduction: Optional Study Method: In addition to the simple method for measuring reproduction described above, a more rigorous method could be used to sample reproductive output by a goldenrod plant. One student group could be selected to test the assumption that length of inflorescence-bearing stems is correlated with reproductive output. This group could measure the length of 25 inflorescence-bearing shoots and collect each of these shoots and place them individually in an envelope or sandwich bag. Upon return to the lab, this group of students could remove all seeds from an inflorescence-bearing stem and weigh the seeds and associated floral structures from inflorescences. The students in the group could repeat this for each of the inflorescence-bearing stems they collected. They could then run a regression analysis to determine if the mass of seeds can be predicted by knowing the length of the inflorescence-bearing stem; students would plot the relationship between inflorescence-bearing stem length and reproductive biomass. Ultimately, there could be an even more elaborate method for determining total seed production that would involve counting individual seeds after weighing the reproductive structures, but it would be impractical to complete this confirmatory study in a lab of this duration.
Do herbivores affect plant growth in a way that might confound the results of your test of these two competing hypotheses? Consider the time of year when you are measuring stem height and the biology of this system; when did the herbivore make its oviposition decision? In light of this, are you making your measurement of plant size at the most appropriate time in the season to fully test these two competing hypotheses?
Link to Literature: Examples of plants that exhibit a changed growth form following herbivory can be found in Weis and Kapelinski (1984) and Paige and Whitham (1987). How did a galling herbivore (Weis and Kapelinski 1984) and a mammalian herbivore (Paige and Whitham 1987) affect the growth of the plants these authors studied?
Can you plan an experiment that would allow you to control or influence plant vigor and monitor or control herbivore attack, and thereby test these competing hypotheses?
Link to Literature: As an example of such an experiment, Daane and Williams (2003) manipulated irrigation levels in a vineyard and asked how the differing hydric conditions might affect herbivore density of a major pest species (a leaf hopper) in California vineyards. According to the Plant Vigor Hypothesis what do you predict will be the effect of watering on leafhopper pest density? What do you predict according to the Plant Stress Hypothesis? What did the authors find? What did they say was the significance of their findings to the challenges of pest management in agricultural ecosystems?
Would you predict that herbivores with different modes of feeding, e.g. foliage feeders, and with greater mobility, compared with gall-forming insects, might choose to feed on plants that are more vigorous or more stressed? Would the habit of living and developing within a gall influence the type of plant a female might choose to oviposit on, compared with the choice that might be made by free-feeding insects such as leaf-chewing insects or phloem feeding insects, e.g. aphids? Explain your reasoning.
Link to Literature: Huberty and Denno (2004) analyzed the evidence for support of the Plant Stress Hypothesis in light of empirical studies of herbivores of diverse feeding modes on plants that varied in physiological condition. Does the study by Huberty and Denno (2004) suggest that the Plant Stress Hypothesis is applicable to all herbivores regardless of feeding mode and the plant tissue they feed on? For example, do Huberty and Denno find that phloem feeders respond to plant stress in the same way that gall formers or free feeders do? Explain your reasoning.
Are there environmental conditions encountered by plants that might influence their response to having tissue consumed by herbivores? Consider plants that are exposed to differing levels of needed resources including water, sunlight, and mineral nutrients and how they might respond to feeding by herbivores.
Link to Literature: Could the reproductive response of plants following herbivory be influenced by the levels of available resources, as proposed in the Continuum of Response Hypothesis (Maschinski and Whitham 1989)? How does the Plant Tolerance model, in its broadest sense, explain or account for variation in plant response to herbivory (Wise and Abrahamson 2005; Fornoni et al. 2003)?
Gall Effect on Growth: Does the presence of a gall influence the subsequent growth of a goldenrod stem? Further questions that might be addressed with regard to gall effects on subsequent growth include: A) do galls affect the ultimate height of the goldenrod stem, B) do galls affect apical dominance and lead to the production of more shoots through the release of dormant meristems? And C) do changes in growth caused by galls affect plant reproduction?
Link to Literature: As cited in question 1A. above, Weis and Kapelinksi (1984) and Paige and Whitham (1987) studied plants that exhibited a changed growth form following herbivory. Did attack by herbivores in these two different systems affect both plant growth form and also reproductive output? Further, McCrea et al. (1985) studied the effect of ball galls on carbon allocation in goldenrod. What conclusions did they make concerning gall effects on carbon allocation and plant growth?
Do you think it is realistic to predict that either the Plant Stress Hypothesis or the Plant Vigor Hypothesis can explain the totality of the ecological interaction between plants and their herbivores?
Link to Literature: (A) Briefly summarize the major findings of the following three papers: (1) Hull-Sanders and Eubanks (2005), (2) Koricheva et al. (1998), and (3), Huberty and Denno (2004). (B) Critique and reflect upon what these papers tell us about the value and contribution of these simple hypotheses to explain complex ecological phenomena.
A pre-lab formative assessment is conducted to prepare students to participate fully in the lab exercise. Students must read the Abstract, Introduction, and Methods sections of the lab exercise before coming to lab. A brief discussion with students, of approximately 10-15 minutes, should lead to review of basic ecology of herbivory and plant-herbivore interactions and the major conceptual issues associated with this lab. Upon conclusion of the discussion, students should write a one minute paper on misconceptions they had, before the discussion, concerning the interactions between plants and herbivores.
Next, students are assessed for this exercise based on prompt sharing of data. If the field portion of the lab is completed promptly, students can return to lab and type their results into a spreadsheet that has been prepared for the entire lab group. If the field portion of the lab runs long and data cant be logged back in the lab, students in each group have the responsibility to send to the instructor a copy of their data in a pre-defined format in an MS Excel spreadsheet by the end of the day (e.g. 5PM for a morning lab). I then forward the entire data set to all students in the class. I assign a small number of points to the members of each group for Data Sharing; if a group fails to send data in a timely way, all members of that group are penalized for failure to complete this part of the assignment.
Students must turn in a lab report in the form of a Brief Communication, not unlike short communications or brief communications in several journals. My intention with this lab report is to encourage students to write succinctly and clearly and to encourage them to produce a complete scientific report. In the report, students are asked to clearly present: 1) the goals of the study, 2) the methods used, 3) the results, including verbal description of the statistical analyses and the figures through which they test their hypotheses, 4) an interpretation of the results in light of the concept they tested in light of the current literature.
The Brief Communication consists of all parts of a traditional lab report, except without an abstract. Students must have a brief but descriptive title for the lab exercise. Students must write a brief Introduction, typically two paragraphs in length with one paragraph focused on the primary concepts in ecology that they will study, and the second paragraph presenting the hypotheses they planned to test. The Methods section is generally fairly brief; students may refer to the lab handout for the methods section, but the lab handout does not count as one of the two citations required for the assignment. The Results section includes figures (at least three for this lab exercise), statistical tests presented in tables (at least two for this exercise), and a verbal description of the study in which they refer to the figures, statistical tests, and tables. Students present a Discussion in which they interpret the outcome of the study and interpret why they obtained the particular results they did. In the Discussion, students must address one or more of the Questions for Further Thought (as recommended by the Instructor); these questions involve the student in higher order thinking, in which they must address issues or concerns about the biology of the organisms involved in this study or the basic ecological theory that is addressed through this lab exercise. The paper must include a Literature Cited section with at least two citations from the primary literature; citations must be used in the Introduction and or Discussion. Students use the citation format for articles from the primary literature using the format used in the References and Links section.
Point allocation totaling 10 points, for the different parts of the lab exercise are as follows (see Appendix 2: Scoring Rubric [66k *.doc] or [44k *.pdf]) for suggested point distributions for each section in the report):
| Title | 0.5 points | |
| Introduction | 2.5 points | |
| Methods | 1.0 points | |
| Results | 3.0 points | (1.25 points for verbal description, 1.25 points for tables/figures, 0.50 points for statistical tests) |
| Discussion | 2.5 points | (1.25 points for conclusions regarding tests of hypotheses, 1.25 points for use of literature to address Questions for Further Thought) |
| Lit Cited | 0.5 points |