VOLUME 3: Table of Contents
TEACHING ISSUES AND EXPERIMENTS IN ECOLOGY
Diversity and the measurement of diversity are central to many issues in ecological research as well as for applying ecology to real world problems. Every textbook in ecology devotes considerable description and explanation of species diversity, species richness, and species evenness. Community ecologists use measures of diversity to study and explain ecological patterns in many different types of communities.
In terrestrial ecosystems, litter decomposition has important effects on processes such as nutrient cycling and community structure. Decomposition is affected by the type and quality of litter, climate, the edaphic conditions (including soil temperature, hydration, and chemistry), and the community of decomposer organisms (Swift et al. 1979).
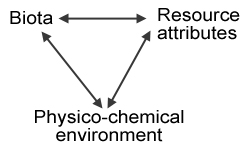
Interactions among factors that control litter decomposition (from Swift et al. 1979).
This model shows the relationships among the three factors that govern litter decomposition rates: the Biota (structure and activity of the biotic soil food webs, i.e., microbes, invertebrates, vertebrates), the Physico-chemical environment (climate, habitat, edaphic factors, i.e., contributions from the non-living environment); and Resource Attributes (primarily plant species diversity and tissue chemistry, i.e., contributions from the living environment). Many studies have shown how both the living and the non-living environments affect soil community structure and diversity (Swift et al. 1979, Elliott et al. 1980, Ingham et al. 1982, Freckman & Virginia 1997). For example, decomposition of plant litter that is high in lignin and/or low in nutrients and is therefore difficult to decompose (resource quality) leads to dominance by fungal-feeding groups in the soil food web (namely, some taxa of nematodes, mites and Collembola), whereas easily broken-down litter is decomposed primarily by bacteria, which is reflected higher up the food chain (Coleman & Crossley 1996). And soil community diversity is at least partially determined by plant community diversity (Siemann et al. 1998). So in this case, the living environment is determining the soil community. On the other hand, recent work suggests that composition and biodiversity of soil organisms itself may have a greater effect on decomposition than has been previously recognized (González and Seastedt 2001, Wardle and Lavelle 1997, Wardle et al., 2003), especially in tropical ecosystems. So in this case, the soil biota is the driving force of the Physico-chemical environment and therefore the Resource Attributes in the Swift et al. (1979) model above. On yet a third hand, the soil Biota can directly affect the Resource Attributes. De Deyn et al. (2003) showed that soil fauna enhanced succession and diversity in a grassland community.
Soil invertebrates play important roles in soil communities. Some directly consume detritus, others consume detritivores, whereas others are higher-level carnivores that can indirectly control decomposition by their effects on lower levels of the food web. The classic study of detrital food webs was conducted by Gist and Crossley (1975), showing which invertebrate groups are detritivores and which are carnivorous. This reference is somewhat hard to find; Smith and Smith (2001, p. 496) has a good description of the major findings of that study.
Soil invertebrates are clearly affecting litter decomposition rates, soil aeration, nutrient mineralization, primary production, and other ecosystem services related to soil ecosystem function and agroecological conservation (e.g., Six et al. 2002). With interest in global climate change has come the realization that soil biota may strongly affect soil CO2 sequestration and release, which is a critical variable in climate change models. Agroscientists and restoration ecologists have found that soil biota play critical roles in toxic chemical and metal mobility and remediation; they directly affect disturbed ecosystem recovery/ ecological restorations that occur after fire, UV-B exposure, post-urbanization, and herbicide-stressed soils (e.g., Lal 2002). Bioprospectors carry out the search for novel antibiotics and other drugs among the billions of soil microorganisms. Soil invertebrates are also recognized for their role in mediating or determining belowground interactions among plants. Because they are often prey for vertebrates such as birds and mammals, they have vital roles in the food chains that include those animals.
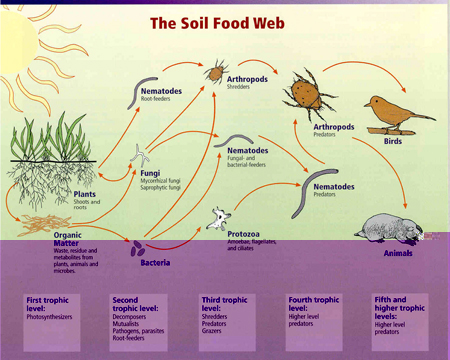
full size image
Relationships between soil food web, plants, organic matter, and birds and mammals. Image courtesy of USDA Natural Resources Conservation Service, http://soils.usda.gov/sqi/concepts/soil_biology/biology.html
Most students of ecology rarely have an opportunity to manipulate data sets that are self-generated and then derive diversity indices and/or graphical representations of diversity. In this class you have that opportunity, and the Soil Invertebrates Diversity Laboratory is designed to enhance your skills at calculating and interpreting diversity indices.
In order to understand gain a good background on how species diversity is determined, you should review the relevant chapters in your textbook. You can also find quite a few informative web sites. Some of the best I have found are http://www.denniskalma.com/biodiversitymeasurement.html, http://www.tnstate.edu/ganter/B412%20Ch%2015&16%20CommMetric.html, and http://www.mdsg.umd.edu/Education/biofilm/diverse.htm. The National Biological Information Infrastructure web site on this topic (http://www.nbii.gov/issues/biodiversity/) also gives some good background. This site at the University of Reading in the UK (http://www.rdg.ac.uk/ssc/software/diversity/diversity.html) even has an Excel add-in for calculating diversity indices. For additional sites, do a Google search on the words measuring (or measure), species and diversity.
______________________________________________________________
The class will be measuring soil invertebrate density at a nearby site containing several different forest types, as well as nonforested areas. Our class has made use of the nearby St. Annes Convent in Melbourne, KY, near the Ohio River. We have several forest types that we can sample, including a Shumard oak (Quercus schumardii)tulip-poplar (also called tulip tree and yellow-poplar; Liriodendron tulipifera) forest; a more mesic American beech (Fagus grandifolia) forest; a riparian forest growing along the banks of a stream; an eastern hemlock (Tsuga canadensis) forest; and several meadows.
Week 1: Beforehand, the class is given some readings on factors thought to drive soil invertebrate diversity, using some of the references described in the Introduction. Either before driving to the field site, or while driving out, the class can discuss what they have read and think about what kind of questions they might test. Depending on the level of your students, you should use either the guided inquiry or bounded inquiry method for asking questions, stimulating discussion and getting students seriously started on thoughtful experiments they can answer meaningful questions. See the Notes to Faculty section for some advice in this area.
The class travels to the field site. After looking at each of the sites, student groups (2-4 students) decide what question they will ask. They will then collect samples of soil and/or litter, using bulb planters/shovels/trowels and plastic zip-lock bags. Note that the soil and litter will have very different communities, so if these are separate horizons in your soils, make sure that you separate them if both are collected.
The samples are then brought back to the lab and placed in Berlese-Tullgren funnels (see Brower et al. 1998 or http://www.albany.edu/natweb/berlese.html for good explanations). The light source is allowed to drive invertebrates into the bottom of the funnel, where they fall into alcohol or other preservative. Light bulbs of various intensities could be used to see how this affects diversity measurements. Similar volumes of soils and/or litter should be used in each funnel. With Carolina Supply funnels, I have used 100 g samples; the soils I have worked with have similar bulk densities, so this translates to a similar volume. If you are working with samples of vastly different bulk densities, such as soil from a dry site vs. a moist site, I suggest using a bulb planter to help you get similar volumes. You may need to use a larger amount than this to get good results if your samples have low invertebrate densities. With Carolina Supply funnels, I have used 60 W bulbs suspended just above the sample. With homemade funnels, you may need to use different sizes of samples. Sample collections have run for a week, as this is the interval between class meetings, but my best estimate is that invertebrates will no longer be collected after 3-5 days. I have collected the invertebrates in 70% ethanol, although apparently others have had good luck with 50-95% alcohol. I strongly suggest a dry run before you let the students do this.
Week 2: Students identify the invertebrates in samples, using dissecting microscopes. Invertebrates can be preserved on glass slides with drops of clear nail polish. Identification down to species is quite difficult, but identification to higher taxa and then to ecological morphotype is relatively straightforward. We identify down to class or order (or occasionally phylum) for non-insects. For insects, we identify down to order. This is done with a dichotomous key and figure (Soil Invertebrate Key; other resources include http://www.cals.ncsu.edu/course/ent591k/kwikey1.html, Edgar 1992, and Dunn and Dunn 1998). Record abundances in each sample by counting total number of each taxon or morphotype. Data are entered into a spreadsheet that can be set up to automatically calculate the Shannon index (Data Tallysheet).
Soil invertebrate biodiversity and evenness calculated using the Shannon index (H´), one of the most popular (other popular indices are described in Chapter 5b of Brower et al 1998). Shannons index measures both richness (the number of species) and evenness, or how evenly individuals are distributed among species. High values of H´ denote high biodiversity. Shannons index is advantageous over simply counting the total number of different species, because the latter is greatly affected by sampling effort (plot size and total number of individuals sampled). The greater the sample, the more rare species you find. H´ is superior because it is calculated from proportions, as you will see, and rare species contribute very little. Therefore, this index is relatively insensitive to the random inclusion or omission of rare species that happens with any sampling effort. The equation for Shannons index is:
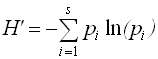
or
![]()
where the pis are the proportion of all observations in the ith species category, and S is the total number of species.
Shannons index is unitless and has no true biological meaning. However, if we take the exponent of this index, or eH´, we have an equivalent number of equally common species. In other words, eH´ is a type of weighted number of species present in your sample for which very common species contribute much more than do rare species to the numerical diversity estimate.
Consider Example 1 below. Note that although there are a total of 5 species in the sample, species A accounts for 70% of the observations. In fact eH´ for this 5 species sample is only about 2.74 equivalently common species. So the diversity of this 5 species community is the same as that of a community with (not quite) 3 species with all the same abundance. This community has a fairly low diversity because it is dominated by species A.
In contrast in Example 2 below, note that all 5 species are equally abundant; consequently eH´ equals 5 species. Thus, this is a high diversity community as high as it can get for a 5 species community. In fact, the maximum value of eH´ will always be S, the number of species, when all species are equally abundant, and the actual value of eH´ should always be compared against S.
| Species | A | B | C | D | E | Total |
|---|---|---|---|---|---|---|
| # obs. | 70 | 10 | 10 | 5 | 5 | 100 |
| pi | 0.7 | 0.1 | 0.1 | 0.05 | 0.05 | |
| H = -[(0.7) × ln(0.7) + 2 × (0.1) × ln(0.01) + 2 × (0.05) × ln(0.05)] | ||||||
| H' = 1.01 and eH´ = 2.74 equivalently common species | ||||||
| Species | A | B | C | D | E | Total |
|---|---|---|---|---|---|---|
| # obs. | 20 | 20 | 20 | 20 | 20 | 100 |
| pi | 0.2 | 0.2 | 0.2 | 0.2 | 0.2 | |
| H = -[5 × (0.2) × ln(0.2)] | ||||||
| H' = 1.61 and eH´ = 5.00 equivalently common species | ||||||
It is also desirable to separately measure richness and evenness. A simple way to calculate richness would be the number of species. We can calculate evenness (J´) from H´. To do this, we first have to calculate the maximum possible diversity (H´max), given the number of species S. That would occur when individuals are distributed evenly among species, as in Example 2. The formula for H´max is:
H´max = ln(S)
and the formula for evenness is:
J' = H'/H´max
Thus, in Example 1, H´max = ln(5) = 1.61, and J´ = 1.01/1.61 = 0.627. In Example 2, H´max is also 1.61, but J´ = 1! That is because H´ in Example 2 is the maximum possible diversity, as the individuals are distributed evenly among species. Note that since we will usually miss rare species in a sample from a community, H´max is usually an underestimate and so J´ is an overestimate of evenness.
It is possible to carry out a t-test to compare the Shannon indices from two different communities provided that you have numerous replicates (and although its hard to say how many is a minimum number, a dozen samples per site would be a good target) (see p. 185 in Brower et al. 1998 or pp. 156-158 in Zar 1999). Since diversity indices are rarely normally distributed, a non-parametric test, such as the Mann-Whitney U test, or bootstrapping would be a safer bet. However, an easier, more straightforward, and more elegant way involves the non-parametric Kolmogorov-Smirnov test, which tests for differences in the trajectories of two bounded cumulative frequency distributions, which as it turns out perfectly characterizes the data you collected. Example 3 demonstrates this test.
Two sites are sampled for 12 species. The following abundances are found:
| Number of Observations | ||
|---|---|---|
| Species | Site 1 | Site 2 |
| a | 2 | 14 |
| b | 4 | 2 |
| c | 6 | 0 |
| d | 1 | 0 |
| e | 8 | 0 |
| f | 0 | 0 |
| g | 9 | 12 |
| h | 3 | 7 |
| i | 4 | 6 |
| j | 6 | 1 |
| k | 3 | 1 |
| Total | 47 | 44 |
First, sort the data for each site by abundance, from highest to lowest (do this separately for each site). Note that species f is not present at either site, so it wont be included. Calculate pi (the percentage of all observations in the ith species category) for each species, then calculate the cumulative percentages, i.e., add each pi to the sum of all preceding pis.
|
|
||||||||||||||||||||||||||||||||||||||||||||||||||||||||||||||||||||||||||||||||||||||||||||||||||||||||
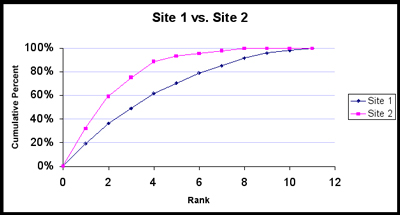
Note that we kept Species c, d and e in the computations for Site 2, because these species are present at Site 1. Now we will add a 0 to the beginning of each cumulative pi column and plot these values against each other.
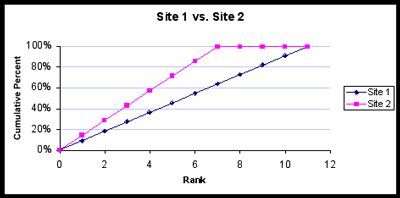
We can glean a lot of information from this plot. Site 1 is richer; notice that its curve does not reach 100% until rank 11, whereas Site 2 reaches 100% at rank 8. Also, the sharper the knee of the line for a community, the lower the sample diversity will be. Do you see why? This is because, if the first few ranked species account for most of the observations, the curve will shoot upward toward y = 100%, and then it will turn sharply and cruise to the right as the rare species add their puny percentages. In contrast, if the Site 1 community were perfectly diverse (all species equally represented), then the trajectory would be a straight line from (0, 0) upward and to the right until it intersects (11, 100%), as shown below. Note that the perfectly diverse Site 2 community is also a straight line until it intersects (7, 100%), as it only has 7 species.
What would happen if a site had the minimum diversity possible? This would be true if one species accounted for 100% of the individuals at a site. This is what Site 1 would look like; Site 2 would look exactly the same, since 100% of the individuals there would also be in the 1st species.
The Kolmogorov-Smirnov test is performed by taking the absolute differences of the cumulative pis, then taking the maximum of these differences (Dmax). For this reason, when using the Kolmogorov-Smirnov test, it is best to pool replicate samples, since your estimates of D are likely to be more precise as you collect more samples. Dmax is then compared against critical values of D (calculated by K and based on the sample sizes of the two data sets). Since the two sites will have different numbers of individuals, you will need to calculate the critical values, rather than looking them up in a table. First, calculate
![]() ;
;
for α=0.05 and 0.01. Kα(0.05)=1.3581 and Kα(0.01)=0.16276. For any α,
![]() .
.
For this example, Dcrit(0.05)=1.3581√[(44+47)/(44×47)]=0.2849 and Dcrit(0.01)=1.6276√[(44+47)/(44×47)]=0.3414. Since Dmax=0.2693, the diversities for each site do not differ significantly at P=0.05.
Calculate values of H´ and J´ for each of your sites. Also calculate the number of equivalently common species, using eH´. Then, using the procedure in Example 3, compare your values of eH´.
______________________________________________________________
The write-up will follow the format of a scientific paper, with a Title, Introduction, Methods & Materials, Results, Discussion, Acknowledgments, and References (or Literature Cited). If you are using Pechenik (2004) in your course, be sure to read Ch. 8 before writing your report, and also pay attention to the pertinent parts of Ch. 3-5. If you are not using Pechenik or a similar guide (or even if you are), you should look at the guidelines given in the TIEE Volume 1 Stomata experiment. The write-up should be no more than 4 double-spaced pages of text (12 point font, 1-inch margins) plus and tables.
______________________________________________________________
______________________________________________________________
This is a (by no means comprehensive) list of web sites showing how you can make your own Berlese-Tullgren funnels. Many materials can be used for the funnels, including soda/milk bottle tops, inexpensive funnels, and even heavy paper. For collection, I use 70% ethanol, although I've seen others use everything from 50-95% ethanol.
______________________________________________________________
There are numerous ways to assess student learning. The main tool I have used is the research report. Generally, by this point in the term, students have already had experience writing reports of this nature. I usually begin by handing out a report from a previous year, with comments, to give them an idea of what is required. I also have them read Chapter 8 in Pechenik (2003) before writing. Ive also found it useful for student to hand in a draft that I comment upon before handing in a final report, especially if this lab is done early in the term. In order to guide both instructors and students in what constitutes a good paper, Ive included the following rubric:
I have also used a rubric that I post for students to use. In this rubric, I have assigned so many points for each section. They can lose a certain amount of the points if they dont include a critical component. For example, in the introduction, if they fail to propose a hypothesis, they could lose 5 out of 10 points.
In addition, students could give oral or poster presentations, with their grade based on that work.
______________________________________________________________
My formative evaluation has been conducted in several ways. First, I always ask students to describe, in the Discussion of their lab report, how the lab could be improved. Unlike the case at many other schools, Ecology Laboratory at Northern Kentucky University is a separate course from the lecture, so student may or may not be taking it at the same time. Thus, at the end of the course, when students fill out a course evaluation, I specifically ask them to comment on which labs they learned the most from and which the least, and why. Finally, I collect a lot of informal feedback while we are doing the lab. For example, the rubric above was generated by student request while a lab was being carried out.
NOTE: An extensive discussion on Evaluation appears in the Teaching section of this site.