VOLUME 2: Table of Contents
TEACHING ISSUES AND EXPERIMENTS IN ECOLOGY
TEACHING
ALL VOLUMES
SUBMIT WORK
SEARCH

ISSUES: FRONTIERS ISSUES TO TEACH ECOLOGY
Article: Stohlgren, T.J., D.T. Barnett, and J.T. Kartesz. 2003. The rich get richer: patterns of plant invasions in the United States. Frontiers in Ecology and the Environment 1(1): 11-14.
SCIENTIFIC TEACHING AND ACTION RESEARCH
Although ecology faculty have extensive research training, most do not realize that they can do research in their own courses. This is a different kind of research than we are used to — often not controlled, without replicates, and so on. But it is still research because we can develop hypotheses, ask specific questions based on these hypotheses, and then collect and analyze data which in turn inform the questions and hypotheses. There are numerous journals dedicated to interesting research on teaching (e.g., Journal of Research in Science Teaching).
One type of classroom research is called Action Research. In this type of research, faculty ask specific questions about their students or their teaching, gain information about these questions, and use this information to learn about teaching and their course in particular. A list of Action Research websites are provided below. Action research is an aspect of Scientific Teaching (Handelsman et al. 2004).
Below we describe a four-step process which you can use to conduct research on your use of the Frontiers article. The theoretical bases for this TIEE Scientific Teaching are three areas of research on learning (DAvanzo 2003 a,b): metacognition (knowing what we know), misconceptions (firmly held beliefs that are incorrect) and adult development stage theory (stages that learners are thought to go through as their thinking about a discipline matures). Read more about these theories here.
Action Research with the Stolgren article: Misconceptions About Correlation versus Cause
Misconceptions: Students come to class with background knowledge that may or may not be correct; when incorrect this information is called a misconception (or prior/alternative/intuitive conception). Students misconceptions are notoriously difficult to change, and numerous studies show that students come to class — and leave — with the same content misinformation even when the content is directly dealt with in a class. (See website below for more information)
You can use this article to address a misconception shared by many students: that correlation signifies cause. That students have this misconception may surprise you which is one of the reasons students retain these alternative conceptions. Faculty are unaware of them!
Students, like most people, confuse correlation and cause. This is understandable since we notice relationships every day that we assume to be causally related. (This is called make sense reasoning.) Sometime there is a causal relationship — for instance, when we eat food we understand that our hunger decreases because of the sugar and other nutrients the food contains.
Of course the coincidence of two events does not mean that one causes the other. It is important for students to appreciate that a major challenge in ecology, and all sciences, is to determine whether events that happen together are causally associated. This lesson will serve students well as they attempt to understand controversies they see everyday, such as sorting out the likely causal relationships between smoking and lung cancer. Two online statistics texts that discuss the cause/correlation confusion, including silly positive correlation examples (such as number of popsicles sold and drownings), are http://davidmlane.com/hyperstat/A62692.html and http://business.clayton.edu/arjomand/book/sbk17.htm.
Doing Action Research with this Issue
The hypothesis you are addressing is: When I use this Issue as a way to discuss correlation versus cause in class, my students understanding of the difference between cause and correlation improves. We suggest that you follow the four-step process outlined below: 1) a pre-test to assess your students knowledge about cause versus correlation, 2) using the Issue as a vehicle for teaching about this difference, 3) a post-test to assess change in students knowledge, and 4) reflection on your findings.
- Step One: Pre-Test — Ask your students to write a Minute Paper in response to the question below. It is easiest to do this at the beginning or end of a class session. Explain to them, in general terms, why you are asking them to do this; stress that this is not a test and that their answers will be anonymous. In the next class session, generally report what you learned from the minute papers and use this as a lead-in to using the Issue in class, however you choose to do that (see Notes to Faculty).
NOTE ON CLASS SIZE: In a small-medium size class, you can read through all of the answers. In a large class, read a sub-sample. In big classes, logistics of collecting Minute Papers can be formidable, so come up with a reasonably simple solution. For instance, some faculty with classes of 300 or more students give out index cards in class, allow students 5 minutes to hand write an answer at the end of class (to a projected question), and ask students to drop the cards in boxes placed at the exit doors.
Minute Paper Question: (Project or hand out both the question and the figure. Clearly tell students how much time they have and what to do with their answers.)
Briefly (50-100 words) respond to Freds interpretation of the graph below. The graph shows ocean water temperature on the X axis and the number of shark attacks per 100,000 swimmers in Australia on the Y axis (this is a made up example). Do you agree with Fred?
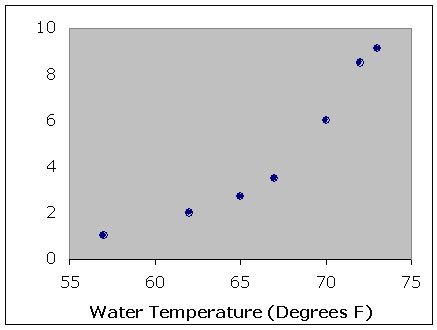
Freds interpretation: Looking at this graph I can see that warm water causes more shark attacks for swimmers in Australia.
- Step Two: Teaching — use the Rich/Richer article(s) in your class, putting special emphasis on correlation, the difference between correlation and cause, and why this distinction is important for students to understand. (Examples of various approaches you can use are in the Table of Student-Active Approaches; the easiest one is turn-to-your neighbor). The first question in the Notes to Faculty deals with cause and effect relationships. There are several good examples of silly relationships in the resources, or you can make up your own.
- Step Three: Post-test — The purpose of the post-test is to assess the impact of your teaching on students understanding of correlation and causation. How you do this depends in part, of course, on their pre-test essays. Here are a few ideas:
- At the end of the class in which you use the Issue (or the next class), ask students to do another minute paper similar to the pre-test one. For instance, ask students to respond to the following: Researchers have found that people over 50 who drink one or two glasses of red wine each day have fewer heart attacks. Does this mean that something in red wine causes fewer heart attacks for these people?
- Use another CAT (Classroom Assessment Technique) such as the muddiest point or directed paraphrasing to obtain immediate feedback at the end of your discussion or lecture in which you discuss correlation and causation.
- On the next exam, add an extra point question focused on correlation/causation.
- Step Four: Reflection and Response — This is probably the hardest part of the whole process — once you have your data, what do you do with it?
- This kind of evaluation is a way for you to think more deeply about your students learning — what you really want them to learn and what inhibits them from achieving this goal. When done well, classroom research like this can help make students thinking more transparent — so that you can better design on ways to get through to them. The idea is to reflect on their learning as opposed to your teaching.
- Discussing your findings with a trusted and knowledgeable colleague may be the best thing to do, if you have such a colleague. The ESAs ECOLOG discussion list (ECOLOG-L@LISTSERV.UMD.EDU) is used by ecology faculty and another venue to share your findings.
- What you do in the class of course depends on what you have learned and also the time you can spend on follow-up. At a minimum, you should report back to the students and give an overview of their answers (good points and ones many missed) and use this as a way to again discuss the contrast between correlation and causation.
- If students made good progress between the pre and post-tests, say so and praise them. Dont expect a big change; modest growth as a result of one class session is a real achievement.
REFERENCES
- DAvanzo, C. 2003a. Application of research on learning to college teaching: ecological examples. BioScience 53: 1121-1128.
- DAvanzo, C. 2003b. Research on learning: Potential for improving college science teaching. Frontiers for Ecology and the Environment 1: 533-540.
- Handelsman, J. et al. 2004. Scientific Teaching. Science 304: 521-522.
RESOURCES
General
- Handelsman, J., D. Ebert-May, R. Beichner, P. Bruns, A. Chang, R. DeHaan, J. Gentile, S. Lauffer, J. Stewart, S. M. Tilghman, and W. B. Wood. 2004. Scientific Teaching, Science. 304: 521-522.
Action Research
- Good overview and history of action research
(http://www.infed.org/research/b-actres.htm) - Overview with focus on curriculum development
(http://informationr.net/ir/1-1/paper2.html) - San Jose State University; brief overview and ideas for how to start
(http://www.accessexcellence.org/LC/TL/AR/) - University of Colorado site; has many articles
(http://carbon.cudenver.edu/~mryder/itc/act_res.html)
Correlation versus Cause
- A Lesson in Correlation vs Causation
From Biology Brought to Life by Jo Handlesman; brief discussion includes description of Kochs experiments with bacteria — a straightforward and interesting example of an experiment showing cause and effect. - Online Statistics Texts
- HyperStat Online Textbook by David M. Lane, Rice University
(http://davidmlane.com/hyperstat/index.html) - Introductory Statistics, David W. Stockburger, SMSU 1998 ed
(http://business.clayton.edu/arjomand/book/sbk00.htm) - Statistics at Square One, T. D. V. Swinscow
(http://bmj.bmjjournals.com/collections/statsbk/index.shtml)
<top>