VOLUME 1: Table of Contents
TEACHING ISSUES AND EXPERIMENTS IN ECOLOGY
TEACHING
ALL VOLUMES
SUBMIT WORK
SEARCH

Figure Set 3: Ecology of Fire
Purpose: To introduce students to the ecology of fire under natural and "controlled" conditions.
Teaching Approach: "Citizen's argument"
Cognitive Skills: (see
Bloom's Taxonomy) — comprehension, interpretation, application
Student Assessment: Oral presentation
FIGURE SET 3
-
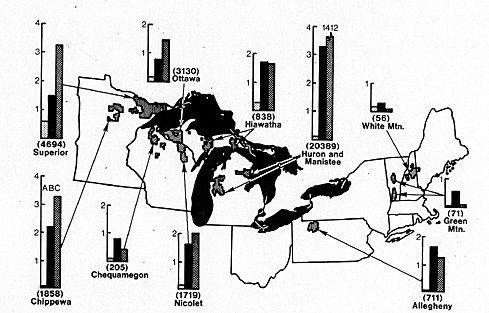
Figure 3A. Fire statistics for northern hardwood forests. Average annual numbers of fires (x10)
caused by lightening (Column A: stippled) and humans (Column B: black). Average
acres (in 100 acre units) burned annually (Column C: cross hatch). Number in
parentheses is largest acreage burned in one year. Data are per million acres of
national forest land. Calculated from U.S. Forest Service Annual Fire Reports from
national forests from 1945-1976. From F. H. Bormann and G. E. Likens 1979. Pattern
and Process in a Forested Ecosystem. Springer-Verlag, New York.
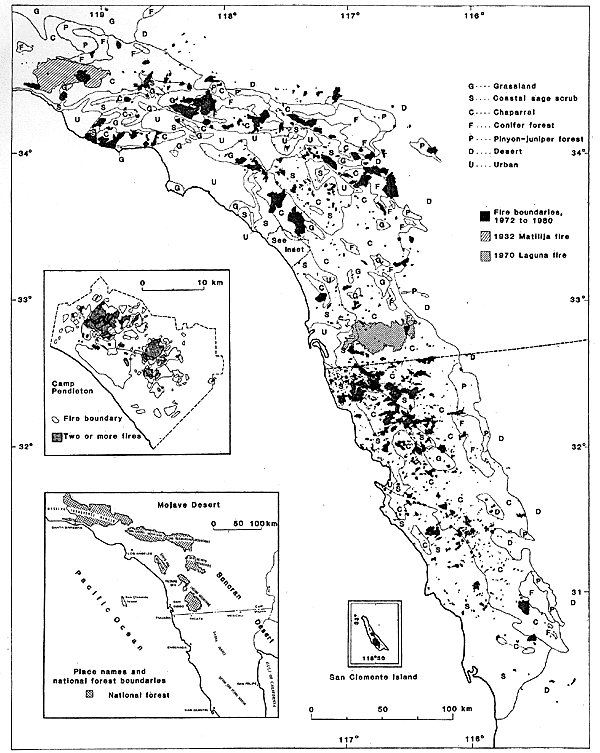
Figure 3B. Wild-land fires in southern CA and northern Baja California, 1972-1980, and vegetation categories. Fire data mapped from Landsat images and vegetation from aerial photographs. From R. A. Minnich. 1983. Fire mosaics in southern California and northern Baja California. Science 219: 1287-1294.
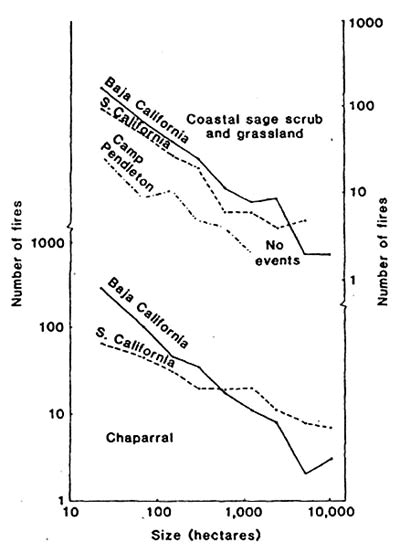
Figure 3C. Number of fires plotted against burn area for coastal sage scrub/ grassland and for chaparral in the two study region, 1972-1980. From R. A. Minnich. 1983. Fire mosaics in southern California and northern Baja California. Science 219: 1287-1294.
For help, see the essay "Helping Your Students to Interpret Figures and Tables."

Figure 3A. Fire statistics for northern hardwood forests. Average annual numbers of fires (x10) caused by lightening (Column A: stippled) and humans (Column B: black). Average acres (in 100 acre units) burned annually (Column C: cross hatch). Number in parentheses is largest acreage burned in one year. Data are per million acres of national forest land. Calculated from U.S. Forest Service Annual Fire Reports from national forests from 1945-1976. From F. H. Bormann and G. E. Likens 1979. Pattern and Process in a Forested Ecosystem. Springer-Verlag, New York.
<top>
______________________________________________________________

Figure 3B. Wild-land fires in southern CA and northern Baja California, 1972-1980, and vegetation categories. Fire data mapped from Landsat images and vegetation from aerial photographs. From R. A. Minnich. 1983. Fire mosaics in southern California and northern Baja California. Science 219: 1287-1294.
<top>
______________________________________________________________

Figure 3C. Number of fires plotted against burn area for coastal sage scrub/ grassland and for chaparral in the two study region, 1972-1980. From R. A. Minnich. 1983. Fire mosaics in southern California and northern Baja California. Science 219: 1287-1294.
<top>