VOLUME 1: Table of Contents
TEACHING ISSUES AND EXPERIMENTS IN ECOLOGY
TEACHING
ALL VOLUMES
SUBMIT WORK
SEARCH

Figure Set 1: Intermediate Disturbance Hypothesis
Purpose: To illustrate the intermediate disturbance hypothesis with 2 field experiments.
Teaching Approach: "Pairs Share"
Cognitive Skills: (see
Bloom's Taxonomy) — comprehension, interpretation, application, analysis
Student Assessment: Take home or in class essay quiz
FIGURE SET 1
-
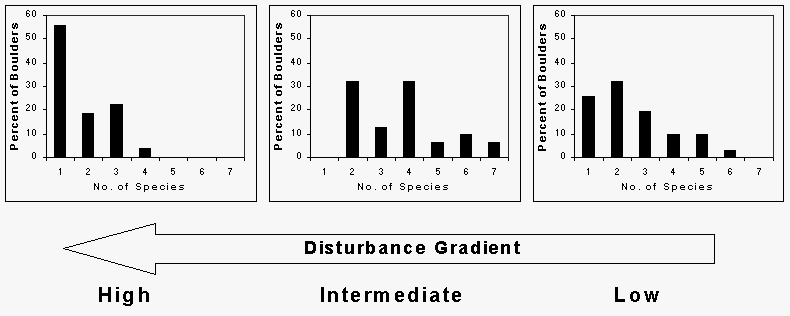
Figure 1A. Degrees of disturbance and species diversity of algae on intertidal boulders in
the intertidal zone in Nov. Data are from 6 permanent plots mapped and photographed monthly for 2 years. High
disturbance = 42% disturbance frequency per month (less than 49 Newtons), Intermediate = 9% per month
(50-294 N), Low = 1% per month (more than 294 N). From W. Sousa. 1979. Disturbance in marine intertidal
boulder fields: the non-equilibrium maintenance of species diversity. Ecology 60: 1225-1239.
Table 1. Species diversity (Average + Standard Error) of macroalgae on boulders subject to 3 degrees of disturbance. Frequent = rock size requiring less than 49 Newtons (N) to move horizontally, intermediate (50-294 N); seldom (more than 294 N). From W. Sousa. 1979. Experimental investigations of disturbance and ecological succession in a rocky intertidal algal community. Ecological Monographs 49: 227-254. and I. Valiela. 1995. Marine Ecological Processes, Springer-Verlag, New York.
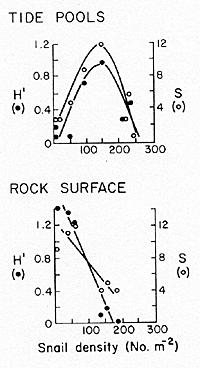
Figure 1B. Effect of density of the herbivorous snail Littorina littorea on diversity of algae in tide pools and rock surfaces on theNew England coast. H' is the Shannon-Weaver diversity index and S is the number of species. From J. Lubchenco. 1978. Plant species diversity in a marine intertidal community: importance of herbivore food preference and algal competitive ability. American Naturalist 112: 23-39 and I. Valiela. 1995. Marine Ecological Processes, Springer-Verlag, New York.
For help, see the essay "Helping Your Students to Interpret Figures and Tables."

Figure 1A. Degrees of disturbance and species diversity of algae on intertidal boulders in the intertidal zone in Nov. Data are from 6 permanent plots mapped and photographed monthly for 2 years. High disturbance = 42% disturbance frequency per month (less than 49 Newtons), Intermediate = 9% per month (50-294 N), Low = 1% per month (more than 294 N). From W. Sousa. 1979. Disturbance in marine intertidal boulder fields: the non-equilibrium maintenance of species diversity. Ecology 60: 1225-1239.
<top>
______________________________________________________________

Table 1. Species diversity (Average + Standard Error) of macroalgae on boulders subject to 3 degrees of disturbance. Frequent = rock size requiring less than 49 Newtons (N) to move horizontally, intermediate (50-294 N); seldom (more than 294 N). From W. Sousa. 1979. Experimental investigations of disturbance and ecological succession in a rocky intertidal algal community. Ecological Monographs 49: 227-254. and I. Valiela. 1995. Marine Ecological Processes, Springer-Verlag, New York.
<top>
______________________________________________________________

Figure 1B. Effect of density of the herbivorous snail Littorina littorea on diversity of algae in tide pools and rock surfaces on the New England coast. H' is the Shannon-Weaver diversity index and S is the number of species. From J. Lubchenco. 1978. Plant species diversity in a marine intertidal community: importance of herbivore food preference and algal competitive ability. American Naturalist 112: 23-39 and I. Valiela. 1995. Marine Ecological Processes, Springer-Verlag, New York.
<top>