VOLUME 1: Table of Contents
TEACHING ISSUES AND EXPERIMENTS IN ECOLOGY
TEACHING
ALL VOLUMES
SUBMIT WORK
SEARCH

Figure Set 5: Eutrophication and Anoxia
Purpose: To help students construct the series of events linking nutrient loading to coastal waters and anoxic events.
Teaching Approach: "Jigsaw"
Cognitive Skills: (see
Bloom's Taxonomy) — knowledge, comprehension, interpretation,
application, synthesis, evaluation
Student Assessment: diagram quiz
FIGURE SET 5
-
Figure 5A-1. Nitrogen (N, millimoles per square meter per year) and phosphorus (P) loadings to different types of
ecosystems (from Nixon, School of Oceanography, URI).
Figure 5A-2. Relationship of dissolved inorganic nitrogen (ammonium and nitrate in millimoles per cubic meter per year) and annual cholophyll (milligrams per cubic meter) in seawater (from Nixon, School of Oceanography, URI and I. Valiela, Marine Biological Laboratory, Woods Hole, MA).
Figure 5B-1. Ammonium concentration (in micromoles; left panel) and chlorophyll a (micrograms/liter; right panel) in 3 sites in the nearshore waters of the Florida Keys between May and July, 1992 (from LaPointe, B. E., and W. R. Matzie. 1996. Effects of stormwater nutrient discharges on eutrophication processes in nearshore waters of the Florida Keys. Estuaries 19: 422-435).
Figure 5B-2. Negative correlation of water column dissolved oxygen (milligrams/liter) at dawn and ammonium (micromoles) in near-shore waters off the Florida Keys (from LaPointe, B. E., and M. W. Clark. 1992. Nutrient inputs from the watershed and coastal eutrophication in the Florida Keys. Estuaries 15: 465-476).
Figure 5C. 3D plot of dissolved oxygen (milligrams/liter) versus tide (meters) and salinity (parts per thousand - ppt) at Port Pine Channel. Number of samples = 4343 (from LaPointe and Matzie 1996).
For help, see the essay "Helping Your Students to Interpret Figures and Tables."
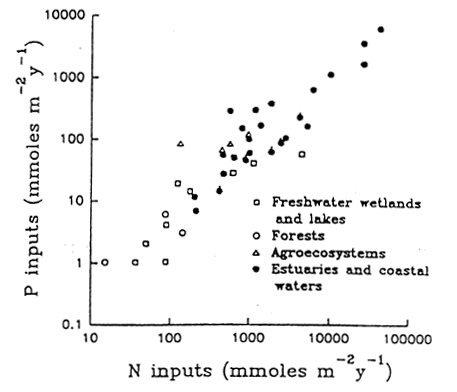
Figure 5A-1. Nitrogen (N, millimoles per square meter per year) and phosphorus (P) loadings to different types of ecosystems (from Nixon, School of Oceanography, URI).
<top>
______________________________________________________________
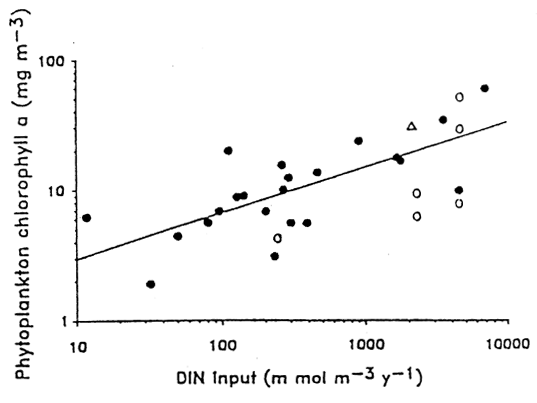
Figure 5A-2. Relationship of dissolved inorganic nitrogen (ammonium and nitrate in millimoles per cubic meter per year) and annual cholophyll (milligrams per cubic meter) in seawater (from Nixon, School of Oceanography, URI and I. Valiela, Marine Biological Laboratory, Woods Hole, MA).
<top>
______________________________________________________________
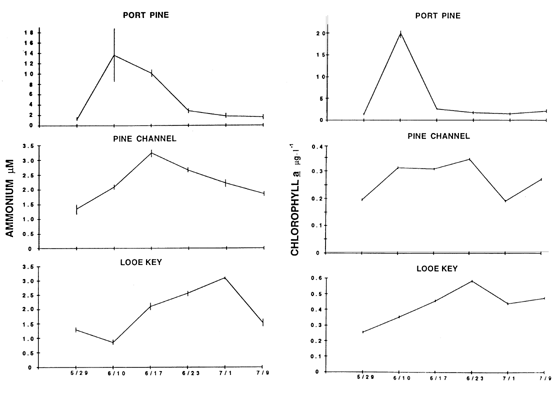
Figure 5B-1. Ammonium concentration (in micromoles; left panel) and chlorophyll a (micrograms/liter; right panel) in 3 sites in the nearshore waters of the Florida Keys between May and July, 1992 (from LaPointe, B. E., and W. R. Matzie. 1996. Effects of stormwater nutrient discharges on eutrophication processes in nearshore waters of the Florida Keys. Estuaries 19: 422-435).
<top>
______________________________________________________________
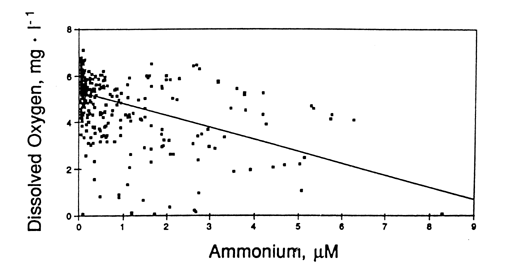
Figure 5B-2. Negative correlation of water column dissolved oxygen (milligrams/liter) at dawn and ammonium (micromoles) in near-shore waters off the Florida Keys (from LaPointe, B. E., and M. W. Clark. 1992. Nutrient inputs from the watershed and coastal eutrophication in the Florida Keys. Estuaries 15: 465-476).
<top>
______________________________________________________________
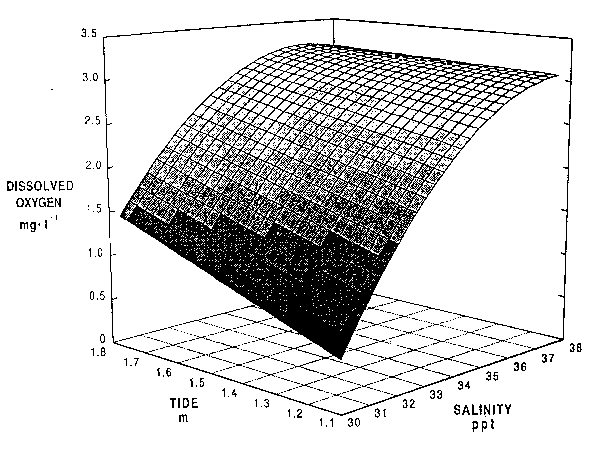
Figure 5C. 3D plot of dissolved oxygen (milligrams/liter) versus tide (meters) and salinity (parts per thousand - ppt) at Port Pine Channel. Number of samples = 4343 (from LaPointe and Matzie 1996).
<top>