VOLUME 1: Table of Contents
TEACHING ISSUES AND EXPERIMENTS IN ECOLOGY
TEACHING
ALL VOLUMES
SUBMIT WORK
SEARCH

Figure Set 1: Evidence for Decrease in Coral Diversity in the Florida Keys
Purpose: To demonstrate the changes in corals in the Florida Keys and motivate students to find out why.
Teaching Approach: "Turn to Your Neighbor"
Cognitive Skills: (see
Bloom's Taxonomy) — knowledge, comprehension, interpretation
Student Assessment: newspaper article
FIGURE SET 1
-
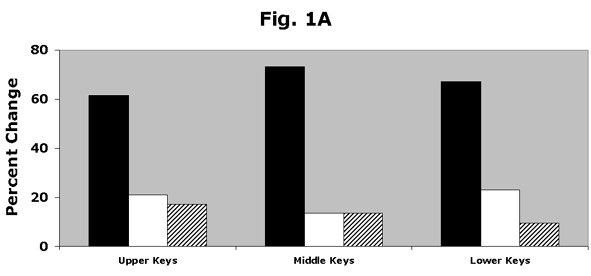
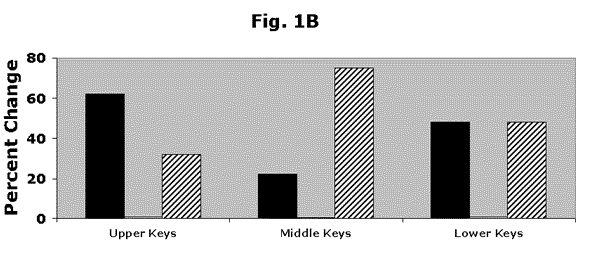
Figure 1A & 1B. Stations in which coral diversity (A) and percent cover (B) significantly decreased (black bars),
increased (white bars), or was unchanged in the Upper Florida Keys (52 stations), middle Keys (44 stations), and lower
keys (43 stations; EPA 2000).
For help, see the essay "Helping Your Students to Interpret Figures and Tables."


Figure 1A & 1B. Stations in which coral diversity (A) and percent cover (B) significantly decreased (black bars), increased (white bars), or was unchanged in the Upper Florida Keys (52 stations), middle Keys (44 stations), and lower keys (43 stations; EPA 2000)
<top>